The EP-Compare program is intended to be used to compare
the tabular results of several simulations including the ABUPS
summary report. To generate tabular reports in EnergyPlus use
the Output:Table:SummaryReports
object and make sure the OutputControl:Table:Style
includes HTML output. EP-Compare displays bar graphs and
monthly line graphs for most of the tabular reports. It can be
used in Windows, Linux and Macintosh systems. The main screen
is shown below:
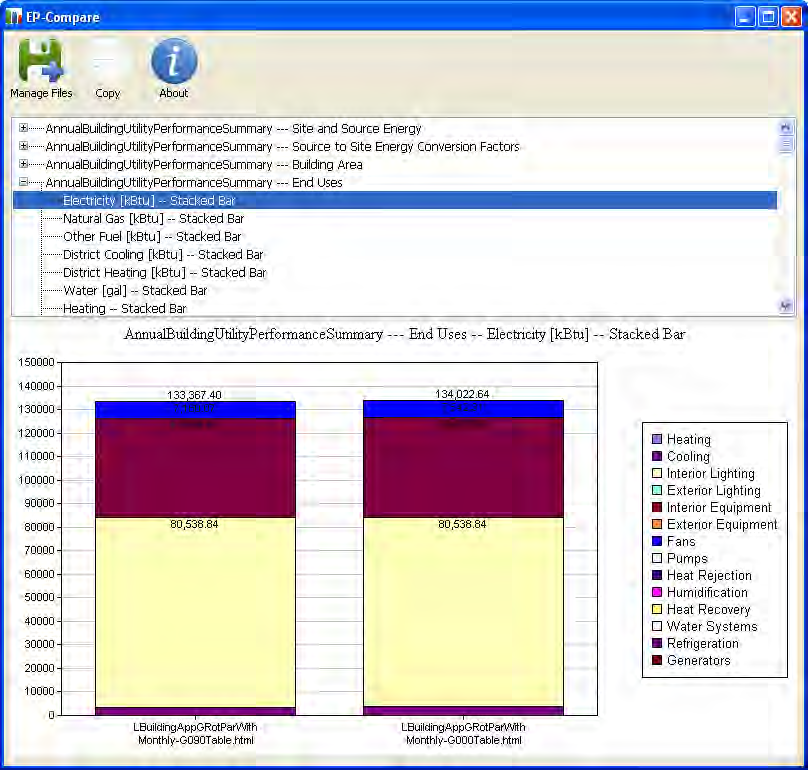
Figure 56. EP-Compare Main Screen
The main screen shows both the graph being displayed at the
bottom and allows the user to select a graph from a list at
the top. The list of graphs is based on each table name and
subtable name and then has a list of graphs supported
including stacked bars, simple bar, 100% stacked bars,
side-by-side bars, and monthly line graphs. The program window
can be resized.
The first time the program is started no graphs are shown
because no files have been selected. To select files use the
“Manage Files” button. This brings up the Manage Files dialog
box shown below:
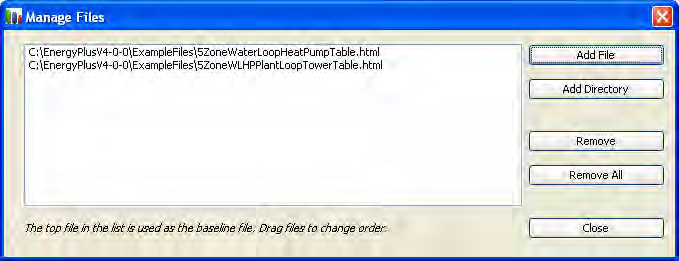
Figure 57. EP-Compare Dialog box
This dialog lets you add and remove files from the list of
files. The files selected should be HTML or HTM files that are
produced by EnergyPlus when using the Output:Table:SummaryReports
object with OutputControl:Table:Style
set to produce HTML files. It is best to compare files that
have similar reports otherwise missing values will be shown as
zeros.The dialog also provides a button to add entire
directories of files but that adding too many files makes the
graphs difficult to understand. To change the order that files
appear in the graph, the files can be dragged up and down the
list of files in the Manage Files dialog. The dialog box
window can be resized to view longer files names if
necessary.
When EP-Compare is started again, the files last selected
are shown in the graph if they are still available.
The Copy button allows the current graph (as it is sized in
the window) to be copied to another application such as
Microsoft Word or PowerPoint. To paste a copied image to those
programs use the Paste Special option and select one of the
bitmap formats.

EP-Compare[LINK]
The EP-Compare program is intended to be used to compare the tabular results of several simulations including the ABUPS summary report. To generate tabular reports in EnergyPlus use the Output:Table:SummaryReports object and make sure the OutputControl:Table:Style includes HTML output. EP-Compare displays bar graphs and monthly line graphs for most of the tabular reports. It can be used in Windows, Linux and Macintosh systems. The main screen is shown below:
Figure 56. EP-Compare Main Screen
The main screen shows both the graph being displayed at the bottom and allows the user to select a graph from a list at the top. The list of graphs is based on each table name and subtable name and then has a list of graphs supported including stacked bars, simple bar, 100% stacked bars, side-by-side bars, and monthly line graphs. The program window can be resized.
The first time the program is started no graphs are shown because no files have been selected. To select files use the “Manage Files” button. This brings up the Manage Files dialog box shown below:
Figure 57. EP-Compare Dialog box
This dialog lets you add and remove files from the list of files. The files selected should be HTML or HTM files that are produced by EnergyPlus when using the Output:Table:SummaryReports object with OutputControl:Table:Style set to produce HTML files. It is best to compare files that have similar reports otherwise missing values will be shown as zeros.The dialog also provides a button to add entire directories of files but that adding too many files makes the graphs difficult to understand. To change the order that files appear in the graph, the files can be dragged up and down the list of files in the Manage Files dialog. The dialog box window can be resized to view longer files names if necessary.
When EP-Compare is started again, the files last selected are shown in the graph if they are still available.
The Copy button allows the current graph (as it is sized in the window) to be copied to another application such as Microsoft Word or PowerPoint. To paste a copied image to those programs use the Paste Special option and select one of the bitmap formats.
Documentation content copyright © 1996-2026 The Board of Trustees of the University of Illinois and the Regents of the University of California through the Ernest Orlando Lawrence Berkeley National Laboratory. All rights reserved. EnergyPlus is a trademark of the US Department of Energy.
This documentation is made available under the EnergyPlus Open Source License v1.0.