Chart Window
NOTE: The Chart Window is an experimental or “beta” feature that is included as a proof of concept. We recognize that it needs more work before it will be more broadly useful.
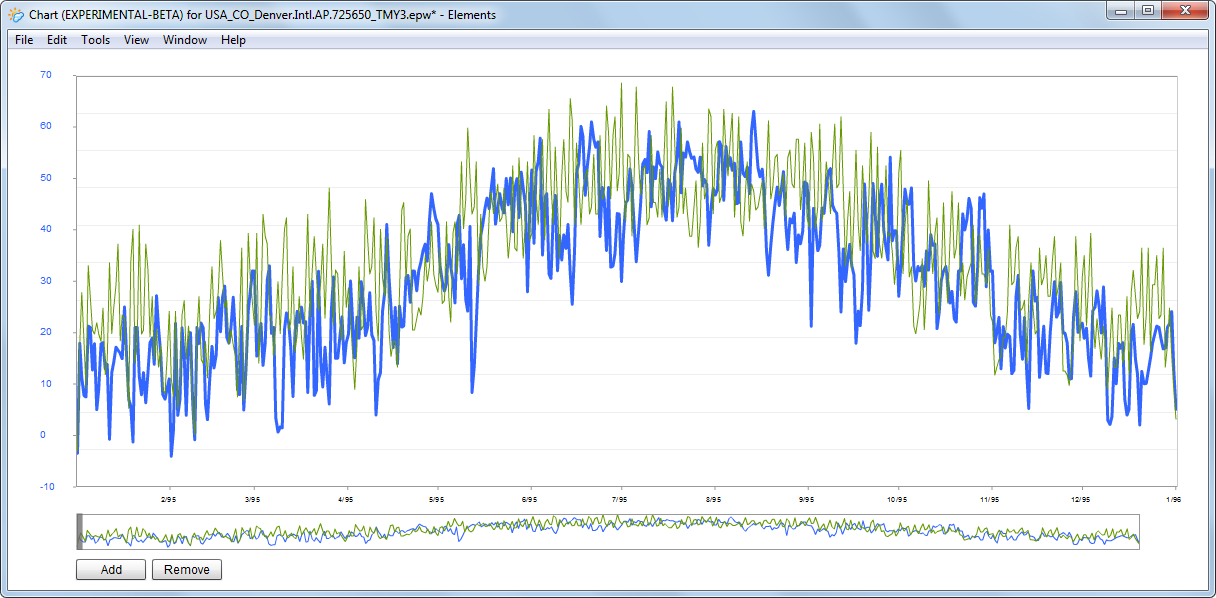
The Chart Window displays an interactive chart of the time-series data for visualization. The Chart Window is opened by clicking the Chart button in the Document Window.
The Chart Window has three main parts: main chart, thumbnail chart, and control buttons.
Add/Remove Variables
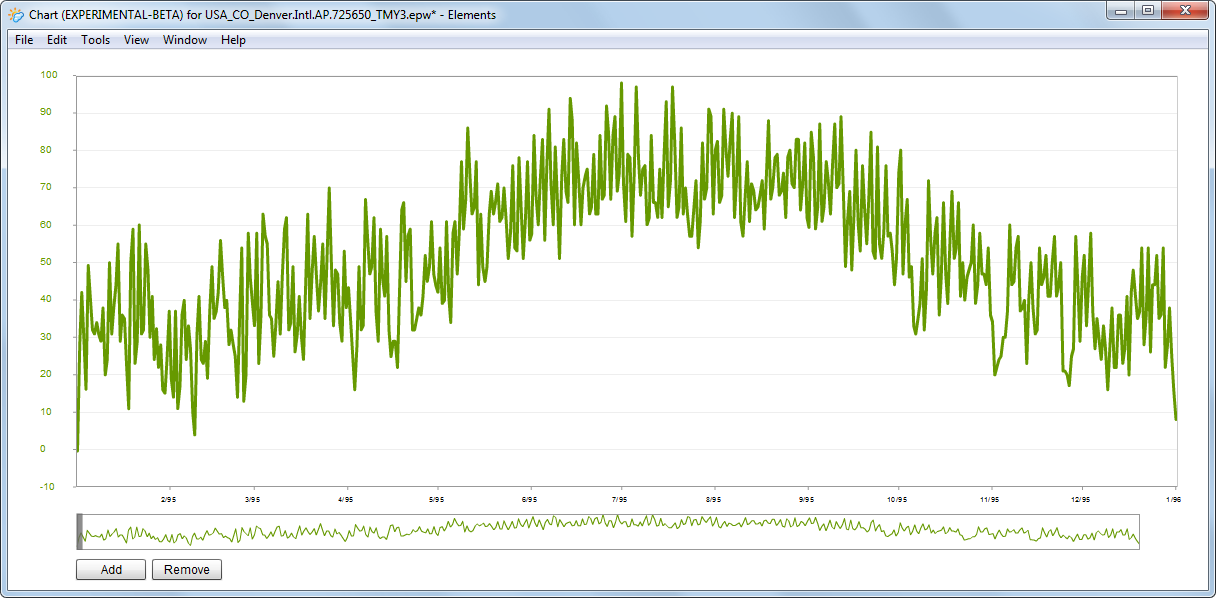
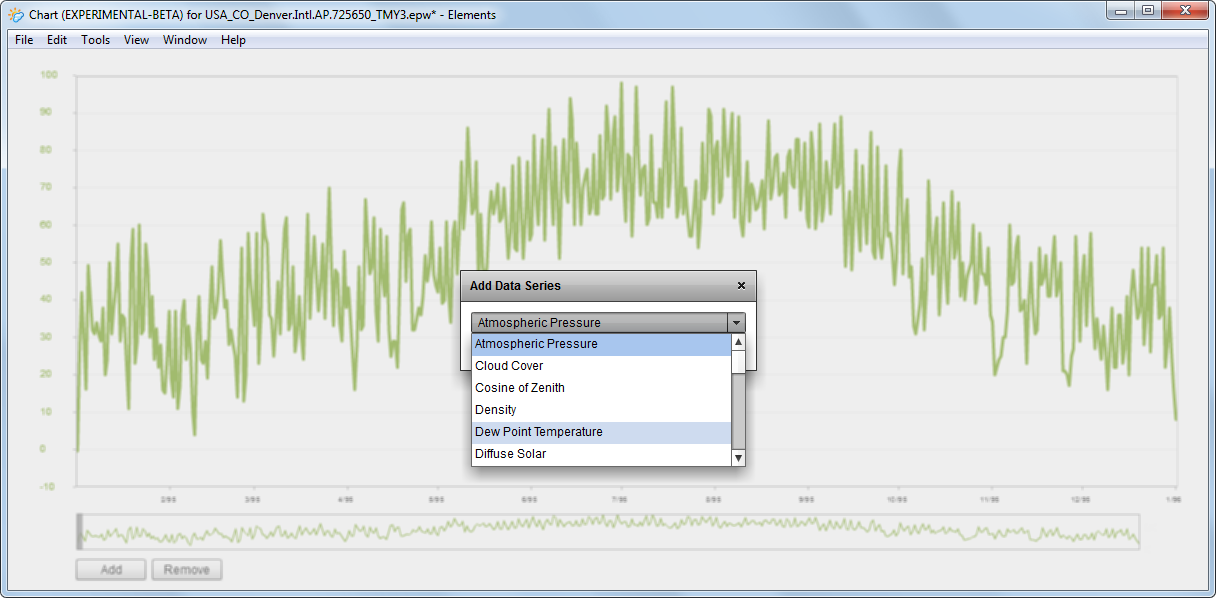
When you first open the Chart Window, the charts will display the dry-bulb temperature variable by default. You can add and remove variables to the view by clicking the Add and Remove buttons respectively. The Add button shows a dialog that allows you to choose a new variable from a drop-down list.
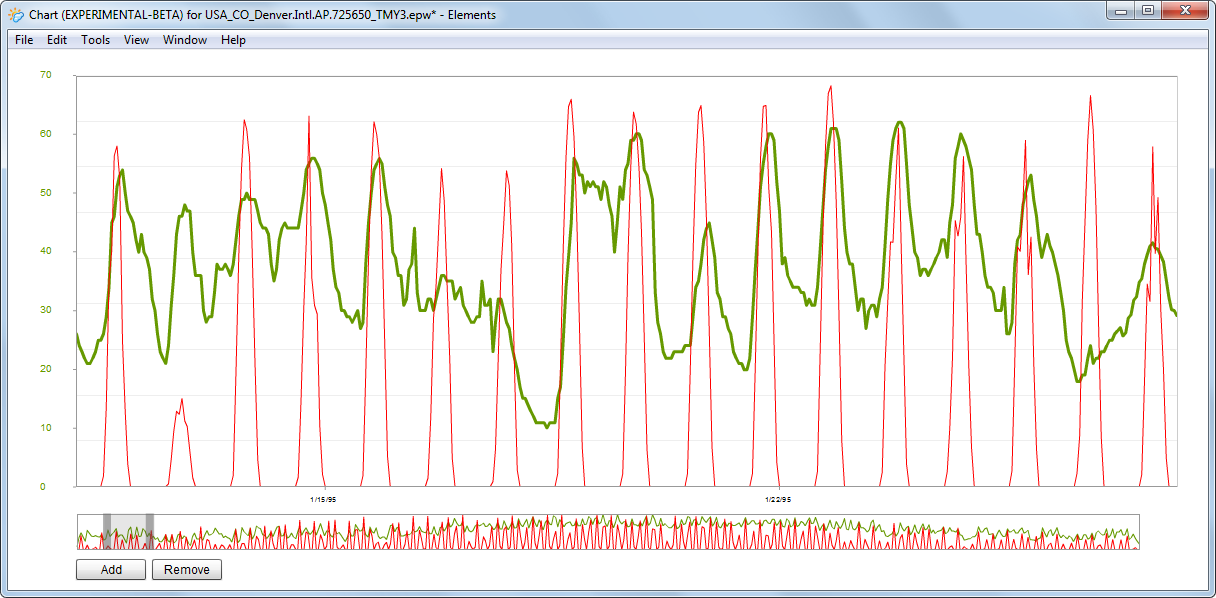
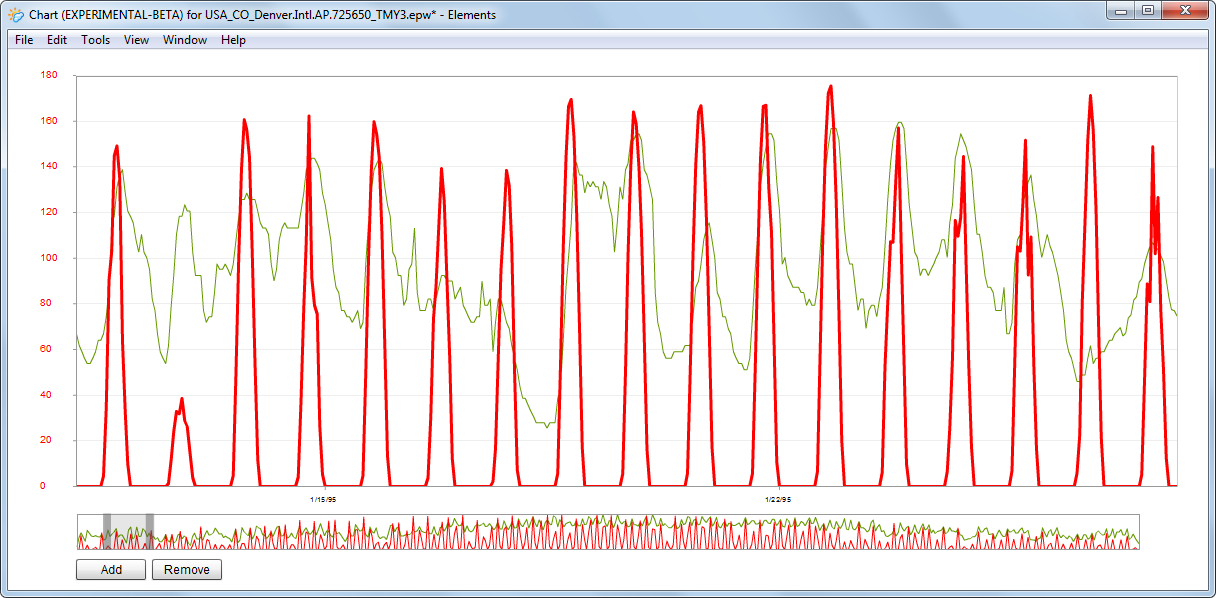
When multiple variables are displayed, you can click on the data lines in the main chart to select one variable over another. When a variable is selected, its line will appear thicker and the scale on the vertical axis will change to match the variable.
Clicking the Remove button removes the currently selected variable.
Thumbnail Chart
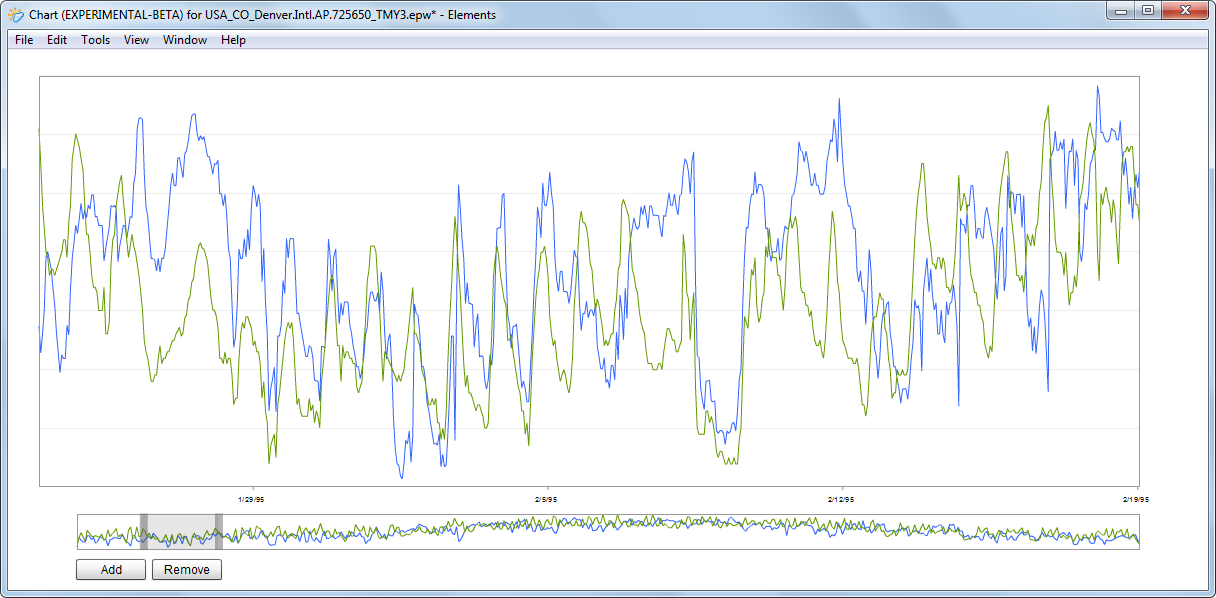
The thumbnail chart is the smaller chart at the bottom of the Chart Window. The thumbnail chart always shows the full data set for the year. The thumbnail chart is also used for zooming and panning through the data displayed in the main chart.
Two dark gray rectangles (these initially appear on top of each other) are shown on the thumbnail chart. By dragging them with your mouse, you can change the range of the data in view on the main chart. When you let go of the dark gray rectangle, Elements may take a second to refresh the plot data. Once you have expanded the dark gray rectangles, you can move the light gray slider area by dragging with your mouse.
Main Chart
The exact value and date/time for a data point can be viewed by hovering your mouse over a data line.
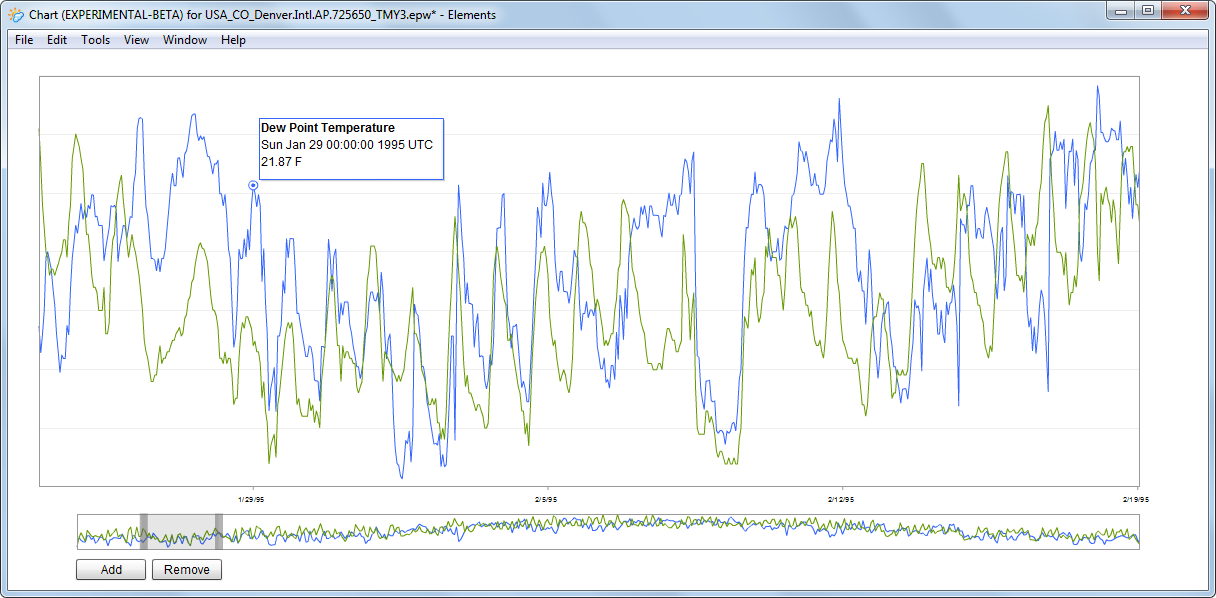
One of the unique features of the main chart is that it can simultaneously display different types of data (e.g., temperature vs. humidity vs. solar) on the same chart. Selecting a data line changes the scale on the vertical axis to match the variable.