Plant/Condenser Loops[LINK]
Integration of System
and Plant[LINK]
In order to integrate the air handling system simulation
with the zones simulation, methods were developed to model the
system air loop and its interactions with the zones due to
temperature controls and the relative difference between the
zone and supply air temperatures. A similar situation is
encountered when integrating the central plant simulation.
Typically, the central plant interacts with the systems via a
fluid loop between the plant components and heat exchangers,
called either heating or cooling coils. In EnergyPlus the
performance of the air systems and plant are interdependent
because the simulations are combined. The plant outputs must
match the system inputs and vice versa. That is, the
temperature of the chilled water leaving the plant must equal
the temperature of the water entering the coils, and the
chilled water flow rate must satisfy mass continuity. In
addition, coil controls are usually necessary to ensure that
the values of chilled water flow variables entering and
leaving the coil remain in a reasonable range. Plants can also
interact with each other so that the operation of a chilled
water loop and chiller will affect the operation of a
condenser water loop.
Current
Primary System Modeling Methodology[LINK]
There are two main types of loops within the HVAC
simulation in EnergyPlus: an air loop and a plant loop. The
air loop is assumed to use air as the transport medium as part
of an air handling system while the plant loops use a liquid
fluid of the user’s choosing (typically water). Condenser
loops are a special case of plant loop that are for heat
rejection and are distinguished by slightily different control
options and applicable equipment types. A user may have any
number of each type of loop in a particular input file. There
are no explicit limits on the number of loops within the
program—the user is only limited by computer hardware.
Execution speed will naturally vary with the complexity of the
input file.
Plant loops are further divided into “half-loops” or
“semi-loops” for organizational clarity and simulation
logistics (see Figure “Connections between the Main HVAC
Simulation Loops and Half-Loops”). These sub-loops, or
half-loop sides, are matched pairs that consist of half of a
main plant loop. Plant loops are broken into supply and demand
sides. The plant demand side half-loop contains equipment that
places a load on the primary equipment. This might include
coils, baseboards, radiant systems, etc. The load is met by
primary equipment such as chillers or boilers on the supply
side half-loop. Each supply side half-loop must be connected
to a demand side half-loop and vice versa. A similar breakdown
is present on condenser loops where the demand side includes
the water side of chiller’s condensers while the supply side
includes condenser equipment such as cooling towers.
The breakdown into two half-loops allows for better
handling and control of information and simulation flow
throughout the program. Direct connections between the
half-loops of the air, plant, and condenser loops are enhanced
by components with connections between the various main loop
types. For example, coils (heating or cooling) are in reality
heat exchangers with an air and a water or refrigerant side.
The air side of the coil is handled within the air loop where
the control of the device is also maintained. The fluid side
of the coil is handled within the plant demand side, which
passes the energy requirements of the coil on to the plant
supply side. All loops are simulated together by successively
modeling each half-loop in a particulary calling order.
Overall iterations ensure that the results for the current
time step are balanced and updated information has been passed
to both sides of the sub-loops as well as across to the other
side of air loop connections such as coils.
The plant equipment on a half-loop is described by a set of
branches for that half-loop. Components can be arranged on a
branch in series, and branches can be placed in parallel, with
some restrictions. Figure “Branch Layout for Individual Plant
Half-Loops” provides an overview of the intended branch layout
for each plant half-loop. Branches are individual legs within
the loop structure. Thus, the segment between point A and
point B is defined as a branch, as is the section between
points E and F. There may be multiple sections (C1 to D1
through Cn to Dn) in between the splitter and mixer.
Each half-loop may only have one splitter and one mixer.
Thus, equipment may be in parallel between the mixer and
splitter, however, within any single branch, there can only be
components in series and not in parallel. The topology rules
for individual half-loops allow a reasonable amount of
flexibility without requiring a complicated solver routine to
determine the actual flow and temperature conditions. Note
that since plant supply and demand are broken up into two
separate half-loops, chillers or boilers may be in parallel to
each other in the supply side and coils may be in parallel to
each other on the demand side. Thus, the restriction of only a
single splitter and mixer on a particular half-loop does not
unduly limit the allowable configurations. In some cases a
single branch can be used to define an entire half-loop, but
in general a half-loop should have a splitter and a mixer even
if all equipment on the sub-loop is simply in series.
In order to simulate diverse underground piping systems, a
generalized model has been implemented which allows placement
of pipes in a solid medium (soil). The model simulates
circuiting effects of multiple pipes by allowing fluid to flow
in the pipes in different directions. The model also has the
capability of simulating interaction with zone surfaces to
account for things such as basement heat transfer in a
foundation heat exchanger. Different aspects of the modelling
approach are described in this section which can assist the
user in determining if this model is appropriate for a
particular application, and determining input parameter
values.
An alternative interface is implemented which provides a
simpler set of inputs for simulating horizontal trench heat
exchangers. The key limitations of the simpler inputs include
all piping in the domain being on a single circuit, all
trenches equidistance apart, and each trench with the same
burial depth. If this is satisfactory for an application, the
GroundHeatExchanger:HorizontalTrench
object is a suitable object. The object uses the same
underlying simulation algorithms and data structures as the
detailed piping system model, but with a simpler set of input
parameters. For other cases and more detailed studies, the
PipingSystem:Underground:* objects provide full
flexibility.
A dual-coordinate system finite volume heat transfer model
of pipes buried in a conducting medium is employed. The
dual-coordinate system consists of a coarse Cartesian system
in the conducting region (the soil, for example) with a
refined radial system in the near-pipe region. The pipes are
connected as objects on the plant loop and are simulated as
needed during loop convergence, while the ground itself is
only simulated once per system time step.
General
Development and Solution Scheme[LINK]
A new heat transfer model is implemented to handle a
diverse set of buried pipe conditions. The model uses a
dual-coordinate system approach to solve a finite volume
domain in a computationally efficient manner. The main idea
behind the dual coordinate system technique is to focus the
computational effort to the region where it is most needed:
near the pipe(s). To this end, a coarse grid Cartesian
coordinate system is used to solve the slow-moving ground heat
transfer. Then, within one of these cells, a radial coordinate
system is configured around the pipe/insulation with a
specialized interface cell between the systems. Figure 241
shows an example of cells surrounding a pipe, including the
radial region in the near-pipe cell, while Figure 242 shows a
zoomed-in view of the near-pipe cell itself.
The ground heat transfer model can be set up in a fully-3D
or quasi-3D manner. In either case, there is a
three-dimensional grid of Cartesian cells placed in the
domain. In fully-3D mode, the axial heat transfer is accounted
for; in quasi-3D mode, the axial effects are ignored and the
result is essentially a set of 2D slices along the length of
the domain. The determination of which method will be utilized
in the final model shall be based upon final testing and on a
balance between accuracy vs. computation time. This option
could be left to the end-user, but this will likely be
unnecessary input overhead.
A fully implicit (and thus numerically stable) formulation
is used to describe all cells, which means an iteration loop
must be implemented. In this solver, an outer iteration loop
is used to bring the entire domain to convergence, while an
inner iteration loop is used over all the radial cells. This
is intended to focus the computational effort even further.
The outer region may converge within one or two iterations,
while the “near-pipe” cells may take much more iteration. For
this reason, it does not make sense to iterate over the entire
domain a large number of times.
Boundary Conditions[LINK]
The farfield boundary condition is defined by a Kusuda and
Achenbach (1965) correlation, which requires annual ground
surface temperature data. As with the current Pipe:Underground
model, the user will be able to enter the correlation
parameters directly, or information from the monthly ground
temperature input object will be used to infer the
parameters.
The ground surface boundary condition is defined by an
energy balance between the surrounding interior cells and the
ground surface, including convection and radiation. As with
the Pipe:Underground
object, the ground surface sun exposure may be an optional
input to allow for a shaded ground surface. In addition to the
standard conduction, convection, and both short- and long-wave
solar radiation at the surface, the ground surface boundary
condition also includes the effects of evapotranspiration in
the surface vegetation—the heat loss due to evaporation from
soil to plant surface, and transpiration internal to the plant
itself. The evapotranspiration rate is calculated as a
moisture loss by using the Walter et al. (2005) model, and
translated into a heat loss by multiplication with the density
and latent heat of evaporation of water. The
evapotranspiration rate is dependent on the type of vegetation
at the surface; the user can vary the surface vegetation from
anywhere between a concrete surface and a fairly tall grass
(about 7”).
Based on the application, an adiabatic boundary condition
will also be implemented and employed on particular surfaces
of the domain. For the case where a basement or under-slab
region is present, for example, an adiabatic boundary will
represent the vertical line of symmetry.
“Pipe Cell” Simulation[LINK]
The ground is discretized into coarse Cartesian cells, some
of which will contain a pipe. These “pipe-cells” are further
discretized into a radial system with a specialized interface
cell to couple these systems. The radial cells consist of a
number of ground cells, with an optional insulation cell, then
the pipe cell, followed by the fluid itself.
The fluid is modeled as a cylindrical cell interacting with
incoming fluid and heat transfer to the pipe. When there is no
flow in the system, the cell essentially becomes radially
adiabatic so that the fluid temperature will float during off
periods. It will not be equal to ground temperatures, unless
it is off for a long time and the transient heat is allowed to
dissipate. When there is flow in the system, the incoming
fluid and heat transfer from the pipe wall balance with the
mass of the cell to come up with a new fluid temperature for
that cell, to be passed downstream to the next cell.
The fluid within the cells is modeled directionally, so
that the flow can be circuited through multiple pipe segments
in different directions. The flow direction in each pipe is
specified by a choice field input.
Basement Interaction[LINK]
The model can also interact with basement surfaces. The
interaction is split into two sections: floor surfaces and
wall surfaces. For each of these, the analysis is lumped,
i.e., all walls are treated as one average wall surface and
all floors are treated as one average floor surface. The
distance that the basement impinges within the domain is
defined by a simple width and height specification. The domain
is then cutaway for that region. Note that these
distances then refer to the exterior surface of the wall or
floor.
The ground heat transfer model does not perform any
transient simulation of the basement surfaces. The transient
condition through these surfaces are left to the appropriate
surface heat balance algorithms. Instead, this model interacts
directly at the outer boundary through the use of an
OtherSideConditions model. The ground heat transfer
model will take the current exterior surface heat flux and use
that as the boundary for neighboring cells. Once convergence
is achieved, the ground model will then effectively apply a
constant surface temperature boundary condition by using a
very high value of convection coefficient. The surface heat
balance algorithms will then pick this up during the next zone
time step.
Mesh Development[LINK]
The mesh is developed by using a few simple parameters.
There are two distinct categories, the large-scale Cartesian
mesh and the near-pipe refined radial mesh.
X, Y, Z mesh
Mesh Layout
Cell density
Radial mesh
Radial mesh thickness
Cell count
The Cartesian mesh uses a cell density parameter to define
the number of cells to use in the simulation. Instead of
requiring a detailed specification of all cell regions in the
domain, this one parameter is used to specify a mesh density
and is applied to all domain regions. The cell density
parameter represents the number of cells within any two domain
partitions. A domain partition is a basement wall or a pipe
placed in the domain. Once these partitions are all laid out
and validated, the regions between them are populated with the
number of cells specified in the cell density parameter.
Although this may lead to a variation of cell size within the
domain, it is assumed that this will help focus computational
intensity in the domain. Of course, the number of cells (cell
density parameter) can be different for each of the X, Y, and
Z directions to allow for further fine tuning of the
domain.
The Cartesian mesh is laid out in either a uniform or
symmetric-geometric fashion. In the former, the cells between
any two domain partitions are equally sized. In the latter,
the cells are smaller near the partitions to again help
fine-tuning computational intensity. If the latter is
selected, the amount of non-uniformity is specified by an
additional parameter.
The radial coordinate system is always uniform for the soil
cells, The two parameters to be specified for this region are
the cell count (the number of soil cells to be generated
outside of the pipe cell), and the radial mesh thickness (the
radial distance from pipe outer wall to the cell boundary).
Each soil cell will then have a radial thickness equal to the
radial mesh thickness divided by the cell count.
Simulation Methodology[LINK]
The actual simulation of this model is performed in two
parts: the ground simulation and the pipe cell simulation.
Since the ground is likely to be slow-moving and easily
converging, it is simulated once per system time step. This
will simulate all the cells in the domain which do not contain
a pipe segment. The boundary conditions for this step are then
the current surface conditions and farfield model along with
the previous values for pipe cell temperature. This small lag
should provide suitable accuracy as the system time step will
usually be smaller than the time constant of the pipe cell.
This decoupling leverages the core of the model development by
again placing computational effort where it is needed most,
near the pipes.
The ground simulation is performed once per time step, but
the pipe cell simulation is performed at each call to the
component. Each pipe will be placed on a plant loop, but not
necessarily on the same plant loop or loop side. Thus, at each
call to the object, that pipe will use the temperatures of the
ground cells near the pipe as boundary conditions to simulate
the “near-pipe” radial cells and fluid cell. In this manner,
the pipes will simulate numerous times following the
convergence flow of the plant loop system.
Kusuda, T. & Achenbach, P. 1965. ‘Earth Temperature and
Thermal Diffusivity at Selected Stations in the United
States’, ASHRAE Transactions Vol. 71, Part 1, pp. 61–75.
Allen, R.G., Walter, I.A., Elliott, R.L., Howell, T.A.,
Itenfisu, D., Jensen, M.E., Snyder, R.L. 2005. The ASCE
standardized reference evapotranspiration equation. Reston,
VA:American Society of Civil Engineers. 59 p.
Pumps in this document.
Essentially, each branch is made up of one or more
components linked together in series. The branch has system
nodes that store properties at a location on the loop
(temperature, enthalpy, flow rate, etc.) at the beginning and
end of the branch as well as between components. Components on
the branch take the conditions of the node at their inlet and
use that information as well as overall control information to
simulate the component and write the outlet data to the node
following the component. This information is then used either
by the next component on the branch or establishes the outlet
conditions for the branch.
Although the plant model in EnergyPlus is quite flexible,
in most cases the topology of the plant system in the model
will be somewhat different from the topology of the actual
plant system in a building. EnergyPlus is focused on modeling
building energy performance over long periods of time and is
not intended as a completely flexible system that can directly
model any actual plant system with its full complexity and
exact layout. Given the design of an actual complex plant
system, the modeler will typically need to develop a simpler
system that conforms to EnergyPlus’s capabilities and strives
to capture the issues important for energy consumption
modeling. Just like complex geometry should be simplified into
thermal zones for energy models, complex plants should to be
simplified into sets of pairs of closed half-loops with the
allowed branch topologies.
Plant Manager[LINK]
Plant Half-Loop Calling
Order[LINK]
Because there can be multiple plant loops in a model that
depend on each other, one job of the plant manager is to
determine an appropriate calling order for the half-loops. The
intial starting calling order (and the order always used prior
to EnergyPlus Version
7) is as follows:
Call all the demand side half-loops of the plant loops (in
input object order)
Call all the supply side half-loops of plant loops (in
input object order)
Call all the demand side half-loops of condenser loops (in
input object order)
Call all the supply side half-loops of the condenser loops
(in input object order).
This initial calling order is then revised during a setup
phase of program execution when the plant component models are
iteratively read in, initialized and sized. The algorithm is
based on information provided by those component models that
connect loops together. The components register that two
loop-sides are connected and declare which one places demands
on the other. If a half loop is connected and places demands
on anther loop, then the calling order for the independent
demanding loop is placed just ahead of the dependent loaded
half-loop. For example a water cooled chiller component model
reports that the supply side of the chilled water loop is
connected to the demand side of the condenser loop and that
the chilled water loop places demands on the condenser loop.
The plant manger algorithm is iterative and repeatedly calls
all of the half loops a total of four times. After this setup
phase, the calling order is fixed for the rest of the
simulation.
Plant Flow Resolver[LINK]
Overview
of the Plant Flow Resolver Concept[LINK]
An important aspect of the solution procedure within plant
loops is the method used to solve for the fluid flow rates
throughout the various half-loops. This involves making the
supply side meet a particular load and flow situation based on
the simulation of the demand side loops. Load distribution is
an issue that must be addressed as well as how flow rates are
adjusted and temperatures are updated. These issues are
discussed in the next several subsections, and the algorithms
described are important to how the plant simulation
functions.
In the first step, the plant loop manager calls the
appropriate module to simulate (in flow order) all of the
components on each branch of the loop except for splitters and
mixers. In this step, each component would set the conditions
at the outlet node including temperature, flow rate, maximum
allowed (design) flow rate, minimum allowed (design) flow
rate, maximum available flow rate, and minimum available flow
rate. This would be based purely on the component’s own
control scheme and thus each component would be free to
request as much (or as little) flow as desired.
In the second step, the loop manager would resolve the flow
at all nodes and through all branches of the local loop. The
components are then simulated with the corrected flows. For
this iteration, the flow resolver sets the flow rate through
each loop component.
Overall Loop Flow Rate[LINK]
The plant models determine an overall fluid flow rate for
each loop based on the dynamic requests and needs of the
components on the loop. The flow resolver examines the
requests and needs of each half-loop and chooses an overall
flow rate. As individual plant components are modeled, they
register their requests for fluid flow which are stored on the
inlet node (variable called MassFlowRateRequest). These
requests for flow are used for two purposes, overall loop
flows and resolution of parallel flows inside a
splitter/mixer. For determining the overall loop flow request,
the requests by individual components are further qualified
into three categories based on the nature of the device.
Need flow and turns loop on
Need flow if loop is already on
Take what ever flow they get.
The loop will only run at all if there are flow requests of
type 1. If there are flow requests of type 2, they will not
turn on the loop but may affect the overall flow rate if it is
already on because of some non-zero type 1 requests. Flow
requests of type 3 will not affect the overall loop flow rate.
These classifications are hard coded and cannot be altered by
the user.
Pump
Control for Plant and Condenser Loops.[LINK]
The
pump is quite simply the component that drives the flow (also
see PipingSystem:Underground Simulation[LINK]
In order to simulate diverse underground piping systems, a
generalized model has been implemented which allows placement
of pipes in a solid medium (soil). The model simulates
circuiting effects of multiple pipes by allowing fluid to flow
in the pipes in different directions. The model also has the
capability of simulating interaction with zone surfaces to
account for things such as basement heat transfer in a
foundation heat exchanger. Different aspects of the modelling
approach are described in this section which can assist the
user in determining if this model is appropriate for a
particular application, and determining input parameter
values.
An alternative interface is implemented which provides a
simpler set of inputs for simulating horizontal trench heat
exchangers. The key limitations of the simpler inputs include
all piping in the domain being on a single circuit, all
trenches equidistance apart, and each trench with the same
burial depth. If this is satisfactory for an application, the
GroundHeatExchanger:HorizontalTrench
object is a suitable object. The object uses the same
underlying simulation algorithms and data structures as the
detailed piping system model, but with a simpler set of input
parameters. For other cases and more detailed studies, the
PipingSystem:Underground:* objects provide full
flexibility.
A dual-coordinate system finite volume heat transfer model
of pipes buried in a conducting medium is employed. The
dual-coordinate system consists of a coarse Cartesian system
in the conducting region (the soil, for example) with a
refined radial system in the near-pipe region. The pipes are
connected as objects on the plant loop and are simulated as
needed during loop convergence, while the ground itself is
only simulated once per system time step.
General
Development and Solution Scheme[LINK]
A new heat transfer model is implemented to handle a
diverse set of buried pipe conditions. The model uses a
dual-coordinate system approach to solve a finite volume
domain in a computationally efficient manner. The main idea
behind the dual coordinate system technique is to focus the
computational effort to the region where it is most needed:
near the pipe(s). To this end, a coarse grid Cartesian
coordinate system is used to solve the slow-moving ground heat
transfer. Then, within one of these cells, a radial coordinate
system is configured around the pipe/insulation with a
specialized interface cell between the systems. Figure 241
shows an example of cells surrounding a pipe, including the
radial region in the near-pipe cell, while Figure 242 shows a
zoomed-in view of the near-pipe cell itself.
The ground heat transfer model can be set up in a fully-3D
or quasi-3D manner. In either case, there is a
three-dimensional grid of Cartesian cells placed in the
domain. In fully-3D mode, the axial heat transfer is accounted
for; in quasi-3D mode, the axial effects are ignored and the
result is essentially a set of 2D slices along the length of
the domain. The determination of which method will be utilized
in the final model shall be based upon final testing and on a
balance between accuracy vs. computation time. This option
could be left to the end-user, but this will likely be
unnecessary input overhead.
A fully implicit (and thus numerically stable) formulation
is used to describe all cells, which means an iteration loop
must be implemented. In this solver, an outer iteration loop
is used to bring the entire domain to convergence, while an
inner iteration loop is used over all the radial cells. This
is intended to focus the computational effort even further.
The outer region may converge within one or two iterations,
while the “near-pipe” cells may take much more iteration. For
this reason, it does not make sense to iterate over the entire
domain a large number of times.
Boundary Conditions[LINK]
The farfield boundary condition is defined by a Kusuda and
Achenbach (1965) correlation, which requires annual ground
surface temperature data. As with the current Pipe:Underground
model, the user will be able to enter the correlation
parameters directly, or information from the monthly ground
temperature input object will be used to infer the
parameters.
The ground surface boundary condition is defined by an
energy balance between the surrounding interior cells and the
ground surface, including convection and radiation. As with
the Pipe:Underground
object, the ground surface sun exposure may be an optional
input to allow for a shaded ground surface. In addition to the
standard conduction, convection, and both short- and long-wave
solar radiation at the surface, the ground surface boundary
condition also includes the effects of evapotranspiration in
the surface vegetation—the heat loss due to evaporation from
soil to plant surface, and transpiration internal to the plant
itself. The evapotranspiration rate is calculated as a
moisture loss by using the Walter et al. (2005) model, and
translated into a heat loss by multiplication with the density
and latent heat of evaporation of water. The
evapotranspiration rate is dependent on the type of vegetation
at the surface; the user can vary the surface vegetation from
anywhere between a concrete surface and a fairly tall grass
(about 7”).
Based on the application, an adiabatic boundary condition
will also be implemented and employed on particular surfaces
of the domain. For the case where a basement or under-slab
region is present, for example, an adiabatic boundary will
represent the vertical line of symmetry.
“Pipe Cell” Simulation[LINK]
The ground is discretized into coarse Cartesian cells, some
of which will contain a pipe. These “pipe-cells” are further
discretized into a radial system with a specialized interface
cell to couple these systems. The radial cells consist of a
number of ground cells, with an optional insulation cell, then
the pipe cell, followed by the fluid itself.
The fluid is modeled as a cylindrical cell interacting with
incoming fluid and heat transfer to the pipe. When there is no
flow in the system, the cell essentially becomes radially
adiabatic so that the fluid temperature will float during off
periods. It will not be equal to ground temperatures, unless
it is off for a long time and the transient heat is allowed to
dissipate. When there is flow in the system, the incoming
fluid and heat transfer from the pipe wall balance with the
mass of the cell to come up with a new fluid temperature for
that cell, to be passed downstream to the next cell.
The fluid within the cells is modeled directionally, so
that the flow can be circuited through multiple pipe segments
in different directions. The flow direction in each pipe is
specified by a choice field input.
Basement Interaction[LINK]
The model can also interact with basement surfaces. The
interaction is split into two sections: floor surfaces and
wall surfaces. For each of these, the analysis is lumped,
i.e., all walls are treated as one average wall surface and
all floors are treated as one average floor surface. The
distance that the basement impinges within the domain is
defined by a simple width and height specification. The domain
is then cutaway for that region. Note that these
distances then refer to the exterior surface of the wall or
floor.
The ground heat transfer model does not perform any
transient simulation of the basement surfaces. The transient
condition through these surfaces are left to the appropriate
surface heat balance algorithms. Instead, this model interacts
directly at the outer boundary through the use of an
OtherSideConditions model. The ground heat transfer
model will take the current exterior surface heat flux and use
that as the boundary for neighboring cells. Once convergence
is achieved, the ground model will then effectively apply a
constant surface temperature boundary condition by using a
very high value of convection coefficient. The surface heat
balance algorithms will then pick this up during the next zone
time step.
Mesh Development[LINK]
The mesh is developed by using a few simple parameters.
There are two distinct categories, the large-scale Cartesian
mesh and the near-pipe refined radial mesh.
X, Y, Z mesh
Mesh Layout
Cell density
Radial mesh
Radial mesh thickness
Cell count
The Cartesian mesh uses a cell density parameter to define
the number of cells to use in the simulation. Instead of
requiring a detailed specification of all cell regions in the
domain, this one parameter is used to specify a mesh density
and is applied to all domain regions. The cell density
parameter represents the number of cells within any two domain
partitions. A domain partition is a basement wall or a pipe
placed in the domain. Once these partitions are all laid out
and validated, the regions between them are populated with the
number of cells specified in the cell density parameter.
Although this may lead to a variation of cell size within the
domain, it is assumed that this will help focus computational
intensity in the domain. Of course, the number of cells (cell
density parameter) can be different for each of the X, Y, and
Z directions to allow for further fine tuning of the
domain.
The Cartesian mesh is laid out in either a uniform or
symmetric-geometric fashion. In the former, the cells between
any two domain partitions are equally sized. In the latter,
the cells are smaller near the partitions to again help
fine-tuning computational intensity. If the latter is
selected, the amount of non-uniformity is specified by an
additional parameter.
The radial coordinate system is always uniform for the soil
cells, The two parameters to be specified for this region are
the cell count (the number of soil cells to be generated
outside of the pipe cell), and the radial mesh thickness (the
radial distance from pipe outer wall to the cell boundary).
Each soil cell will then have a radial thickness equal to the
radial mesh thickness divided by the cell count.
Simulation Methodology[LINK]
The actual simulation of this model is performed in two
parts: the ground simulation and the pipe cell simulation.
Since the ground is likely to be slow-moving and easily
converging, it is simulated once per system time step. This
will simulate all the cells in the domain which do not contain
a pipe segment. The boundary conditions for this step are then
the current surface conditions and farfield model along with
the previous values for pipe cell temperature. This small lag
should provide suitable accuracy as the system time step will
usually be smaller than the time constant of the pipe cell.
This decoupling leverages the core of the model development by
again placing computational effort where it is needed most,
near the pipes.
The ground simulation is performed once per time step, but
the pipe cell simulation is performed at each call to the
component. Each pipe will be placed on a plant loop, but not
necessarily on the same plant loop or loop side. Thus, at each
call to the object, that pipe will use the temperatures of the
ground cells near the pipe as boundary conditions to simulate
the “near-pipe” radial cells and fluid cell. In this manner,
the pipes will simulate numerous times following the
convergence flow of the plant loop system.
Kusuda, T. & Achenbach, P. 1965. ‘Earth Temperature and
Thermal Diffusivity at Selected Stations in the United
States’, ASHRAE Transactions Vol. 71, Part 1, pp. 61–75.
Allen, R.G., Walter, I.A., Elliott, R.L., Howell, T.A.,
Itenfisu, D., Jensen, M.E., Snyder, R.L. 2005. The ASCE
standardized reference evapotranspiration equation. Reston,
VA:American Society of Civil Engineers. 59 p.
Pumps). How it reacts depends on several different
conditions. In total, there are three different decision
variables, two of which are defined by user input. These three
deciding factors are whether the pump is constant or variable
speed, whether the pump operation is continuous or
intermittent, and whether or not there is a request for
overall loop flow. After the overall loop flow request has
been determined the simulation knows what the loop would like
to do. The next thing it does is simulation all the loop pumps
to see what the pumps can actually provide. Then the overall
loop flow is bounded by the minimum and maximum that the loop
pumps can provide at that time. The operation of a constant
speed pump is fairly straightforward. If the user designates a
constant speed pump that is operating continuously, the pump
will run regardless of whether or not there is a load. This
may have the net effect of adding heat to the loop if no
equipment is turned on. If the pump is constant speed and
operates intermittently, the pump will run at its capacity if
a load is sensed and will shut off if there is no load on the
loop.
A variable speed pump is defined with maximum and minimum
flow rates that are the physical limits of the device. If
there is no load on the loop and the pump is operating
intermittently, then the pump can shutdown. For any other
condition such as the loop having a load and the pump is
operating intermittently or the pump is continuously operating
(regardless of the loading condition), the pump will operate
and select a flow somewhere between the minimum and maximum
limits. In these cases where the pump is running, it will try
to meet the flow request for the overall loop.
In many cases, the first estimate of flow requested by the
demand side tends to be fairly accurate and the flow rate does
not vary in subsequent iterations. However, because there is
the possibility that the coils or some other component might
request more flow in future iterations during the same time
step, the program must not only set flow rates but also
maintain a record of the current maximum and minimum flow rate
limits. This information is important not only to the pump
itself but also to other pieces of equipment which may control
their flow rates and thus require knowledge of the limits
within which they may work. In general, the decisions on what
to set the maximum and minimum flow rates is directly related
to the type of pump (constant or variable speed). For constant
speed pumps, the maximum and minimum flow rate values are the
same and thus if the flow requested does not match this, the
other components must either deal with the flow or a bypass
branch must be available to handle the excess flow. For
variable speed pumps, the maximum and minimum flow rates are
set by the user-defined limits.
Plant/Condenser Supply
Side[LINK]
Component models, such as boilers, chillers, condensers and
cooling towers are simulated on the supply side of the plant
and condenser loops. In order to allow specification of
realistic configurations, the plant loop managers were
designed to support parallel-serial connection of component
models on the loop. In addition, loop managers were designed
to support both semi-deterministic models (e.g. the parameter
estimation models of the ASHRAE Primary Toolkit [Pedersen
2001]) and “demand based” models (e.g. the performance map
models of BLAST and DOE2.1E). As a result, the loop manager
must be able to simulate models that require the mass flow
rate as an input and models that calculate the mass flow rate
as an output—sometimes in the context of a single loop
configuration.
In order to achieve these design criteria without resorting
to a pressure based flow network solver in the HVAC portion of
the code, a rules-based “flow resolver” was developed for the
EnergyPlus plant manager. The flow resolver is based on the
following assumptions and limitations:
Each loop is only allowed to have a single splitter and a
single mixer
Due to the fact that there can only be one splitter and one
mixer on a given loop, it follows logically that there can be
at most one bypass on each loop side
No other components may be in series with a bypass, i.e., a
branch that contains a bypass may have no other equipment on
that branch
Equipment may be in parallel only between the splitter and
mixer components of a loop
Equipment may be hooked together in series in each branch
of the loop
Flow rates on individual branches will be controlled using
maximum and minimum available flow rate limits
The flow resolver employs a simple predictor-corrector
algorithm to enforce mass continuity across the plant loop
splitter as shown in the following figure.
As previously discussed, the pump establishes the total
loop mass flow rate by setting the flow in the first supply
side branch. In the second step, a predictor algorithm calls
to simulate each piece of equipment on the loop and they
update their mass flow rate requests based on the current flow
rates, temperatures and load dispatch requests. The loop
manager calls the appropriate module to simulate (in flow
order) all of the components on each branch of the loop except
for splitters and mixers. In this step, each component sets
the conditions at its outlet node including temperature and
sets component flows on the inlet node. Each component and
branch is classified for their type of flow control. Prior to
version 7 this was input by the user where branch objects were
tagged in the user input file as an ACTIVE, SERIESACTIVE,
PASSIVE or BYPASS type of model. As of version 7 this has been
hard coded and the input is no longer used. An ACTIVE flow
control type describes a demand based plant model that
calculates mass flow rate as an output. An ACTIVE component
when OFF will shut down the whole branch irrespective of the
type of other components on the branch. A SERIESACTIVE branch
is like an ACTIVE component except that there are more than
one ACTIVE components on the branch so that two components
requests may be at odds with each other and so it might not
shut down the whole branch when the component is OFF. The flow
resolution algorithm is same for both ACTIVE and SERIESACTIVE
components and in the rest of the document description of one
type will fit the other type too. A PASSIVE type describes a
semi-deterministic model that is simulated with the mass flow
rate as an input. The BYPASS type designates a loop
bypass.
The predictor algorithm first establishes the desired flow
rate of each branch by searching for ACTIVE components on the
branch. The first ACTIVE component in simulation order sets
the desired branch flow. Branches with only PASSIVE components
require a flow rate between the minimum and maximum allowable
branch flow. Branches with a BYPASS component have a branch
flow only when all other branches combined cannot handle the
entire loop flow.
The loop flow resolver makes any necessary “corrections” to
the requested branch flows in order to enforce overall
continuity on the loop. If mass conservation allows all ACTIVE
branches to be satisfied, then the remaining flow is divided
between the PASSIVE branches and as a last resort, the BYPASS.
If there is insufficient flow to meet the branch demand,
ACTIVE branch requests are met first in the order that the
branches appear in the branch list in the input file.
The flow rate is resolved first for each individual branch.
For every branch, the program cycles through each node on the
branch and determines what the flow requests and flow limits
are. The most restrictive flow constraints are assumed to be
valid for the entire branch regardless of component type.
Active components are given highest priority for requesting a
particular flow rate. If there is more than one active
component on a particular branch, then it is assumed that the
active component on the branch with the highest flow request
dictates the flow request for the entire branch.
Once all of the branches have set their flow rates and
constraints, the splitter and mixer must resolve the various
flow requests. The mixer and any branch following the mixer is
passive. Thus, all of the flow control happens at the
splitter. The splitter first attempts to sum the maximum and
minimum constraints from all of the active branches coming out
of the device and compares those to the constraints that are
valid for the branch leading into the splitter. When there is
a mismatch between the outlet constraints and the inlet
constraints, the simulation will defer to the inlet
constraints due to the fact that the pump is in reality
controlling flow on the loop. Since the constraints of the
pump would be passed across to the demand side from the supply
side, an assumption is made that the coils or other demand
side components must live within the bounds of the pump.
Once the flow has been resolved at the splitter, the branch
flow rates and constraints between the splitter and mixer can
be adjusted, if necessary. In some cases, this will be
mandatory to maintain a mass balance at the splitter. When the
flow rate coming out of the splitter does not match the active
branch requests, individual branch flow rates must be adjusted
to provide for the extra flow or the “flow deficit”. When
there is extra flow, the excess flow is sent through any
bypass branch first and then is sent to passive branches in
reverse order of their appearance in the splitter outlet list.
When all of these branches have been exhausted and there is
still excess flow, flow will be increased to the active
branches, also in reverse order. The reverse order guarantees
that the branch appearing first has the highest priority to
receive the flow rate it has requested.
if there is not enough flow to meet all active branch
requests (i.e., a “flow deficit”), then the flow rates through
the bypass and passive branches are set to zero. The flow
rates through the active branches will then be decreased in
reverse order until the splitter outlet flow rate matches the
available flow at the splitter inlet. For a plant loop flow
deficit, the bypass and passive branch flows are also set to
zero, and flow rates for each active branch are calculated as
follows:
where:
It is also necessary to monitor the flow constraints at the
branches and components since once the flow rates are changed,
the components must be resimulated by the controlling loop
(air loop, zone equipment, or plant supply side). The
controllers for these components must know if the constraints
have been modified so that the simulation does not toggle
between a component requesting a flow that the pump cannot
meet and the pump then resetting the flow to what it can
provide. Note that once a flow rate for any component has
changed that this signals the need to resimulate any sub-loop
to which it might have an indirect connection. Currently, this
means that if a flow rate on the plant demand side changes,
the simulation must recalculate the conditions on both the air
loop and zone equipment sub-loops since coils and other
equipment could be on either side of the main air loop.
Similarly, if the condenser demand side simulation results in
a change in flow rate through a chiller condenser, then the
plant supply side must be triggered to perform its
calculations again. Care has been taken to avoid cases where
the various half-loops might simply keep triggering the
resimulation of their indirect connections in an infinite
loop.
Loop Capacitance and
Pump Heat[LINK]
The plant model includes simplified methods of modeling
fluid capacitance and the temperature rise because of pumping
and friction. The transition from load or energy based plant
models to a loop based arrangement makes variables of both the
flow rate and the fluid temperature. This means there are more
degrees of freedom that must be controlled. The flow resolver
concept discussed previously controls the fluid flow rates
through the components and maintains an overall mass flow
balance through the loop. However, the temperatures still need
to be controlled and modeled. A purely iterative procedure can
be expected to converge to the appropriate loop temperatures,
but the procedure can become slow to converge under conditions
where the demand changes rapidly or the supply components may
not have enough capacity to meet the system demand. This
situation is somewhat analogous to that existing in the link
between the zone and the air system. In that case, the
convergence and stability of the iterative solution was
greatly improved by adding the thermal capacitance of the zone
air and other fast responding mass within the zone. Based on
that experience, it was decided to add thermal capacitance to
the plant loop model to benefit from the added stability.
Because the thermal capacitance in the zone/system interaction
is relatively small, it was necessary to use a third order
numerical solution there. Although the plant loop’s fluid
thermal capacitance is relatively high, the fluid flows also
have high heat capacity and can change temperatures rapidly a
simple first order solution was not found to be satisfactory
and an exact analytical solution was needed.
In realistic conditions there is often some delay between
changes in supply conditions and corresponding changes at
demand side components due to the transport of fluid round the
loop having a finite velocity.
The act of pumping fluid around a loop adds heat to the
fluid through friction. The slight warming occurs at the pump
and all around the circuit. The amount of heat is equal to the
work done on the fluid by the pump. This so-called pump heat
is a complicating factor in plant simulation because the pump
heat alters the load on primary equipment. A simple method of
accounting for pumping heat is needed that doesn’t increase
the difficulties of the numerical solution and (as of version
7) in EnergyPlus this accomplished by including the pump heat
in the loop capacitance model.
Plant loops include a simple loop capacitance model to
simulate these effects based on a well-stirred tank model.
Each half-loop has a well-stirred tank located at its inlet as
indicated in Figure 112. The temperature of the tank is
modeled as a function of the tank mass, inlet fluid flow rate
and temperature, and pump heat. No energy is lost or gained
because of storage in the loop capacitance.
The total plant loop volume is separated into two tanks, on
on each half-loop inlet. For normal loops (without common
pipes) each tank is one half of the plant loop volume. For
common pipe plant loops, the tank on the supply side inlet has
three fourths of the volume and the tank on the demand side
inlet has one fourth. Each plant loop is assigned a total
fluid volume as user input or an autocalculate routine based
on the design flow rate. The size of the thermal capacitance
affects the speed of recovery from situations where the
setpoint was not maintained. The user must estimate a fluid
volume based on the size of the pipes in the loop. Note that
rough estimates seem to be sufficient. Loop capacitance
(m3) could be calculated from pipe size data but
this is not usually known. If zero capacitance is specified
the above formulation reduces to an instantaneous update in
demand update temperature and the demand inlet temperature
becomes the supply outlet temperature at the previous time
step. If a very large capacitance is specified unrealistic
time delay may result and there may be poor response to
changes in loop setpoint temperature. The loop capacitance
‘autocalculate’ option gives reasonable values and is
calculated as follows,
The tank temperature is modeled by drawing a control volume
and energy balance around the tank and solving for the
temperature. The temperature of each tank is recalculated
whenever the two half-loops are interfaced together. The tank
temperature history is stored at the end of the simulation
timestep. The model equation for tank (and outlet temperature)
is formulated as follows:
The tank temperature at the end of the simulation timestep
is solved by the analytical approach and expressed as
where:
 = Previous system
time-step tank temperature [°C]
= Previous system
time-step tank temperature [°C]
 = Current tank and tank
outlet temperature [°C]
= Current tank and tank
outlet temperature [°C]
 = Current fluid mass flow
rate through the tank [kg/s]
= Current fluid mass flow
rate through the tank [kg/s]
 = Duration of system time
step [second]
= Duration of system time
step [second]
 = Heat capacity of fluid
[J/kg]
= Heat capacity of fluid
[J/kg]
 = Mass of the water in
the tank [kg]
= Mass of the water in
the tank [kg]
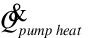 = Heat generated by a
pump in the tank [W]
= Heat generated by a
pump in the tank [W]
When modeling plants using one of the common pipe modes for
plant loops, the same tank model is used but the tanks are
situated differently and account for extra connections. For
common pipe situation, the tanks are located on the outlet of
a half loop with common pipe interactions downstream of the
tank.
The average temperature is reported as the tank
temperature. The average temperature is defined as the value
of an integral function of tank temperature on an interval
[0,δt]
The input specifically related to the flow resolver
consists of the plant BranchList
and the plant ConnectorList
as shown in the Input Output Reference. User defined names
link the plant loop to its branches (contained in the
BranchList) and define the loop splitters and mixers contained
in the ConnectorList.
The Connector:Splitter
and Connector:Mixer
syntax in turn define the relative connection of the branches
to each other on the loop.
The Branch
definition is input in simulation and connection order for all
of the components on the branch. The simulation assumes that
the inlet node of the first component listed on the branch is
the branch inlet node and the outlet node of the last
component listed on the branch is the branch outlet node.
Examples of all the input syntax is shown in the Input/Output
Reference for the appropriate object.
Summary of Load
Distribution Schemes[LINK]
Three load distribution schemes are employed in EnergyPlus.
The figure below illustrates the plant load distribution
algorithm. The total loop demand is calculated and used in the
ManagePlantLoopOperation routine to determine
which equipment is available based on the supervisory control
scheme specified by the user. Once all available components
have been identified the loop demand is distributed to the
available components based on the user specified load
distribution scheme.
The OPTIMAL scheme first loads each component to its
optimal part load ratio (specified in input). Any remaining
loop demand is distributed evenly to all the components. The
SEQUENTIAL scheme loads each component one at a time to
capacity until the loop demand is met. The components are
loaded up in the order that they appear in the equipment list
specified in input. The UNIFORM scheme first divides the load
evenly among all available components. If some components do
not have the capacity to meet the uniformly distributed load,
the remaining load is divided among the remaining
components.
Summary
of Plant Loop Demand Calculation Schemes[LINK]
There are two plant loop demand calculations schemes in
EnergyPlus. There is a SingleSetPoint and a
DualSetPointDeadband; the
SingleSetPoint is the default if that field
is left blank in the PlantLoop
object. In the SingleSetPoint scheme the Plant Loop requires
that a Setpoint Manager set a single setpoint value that sets
Node%TempSetPoint. Examples of this Setpoint Manager would be:
the objects SetpointManager:Scheduled,
SetpointManager:OutdoorAirReset,
etc. For the DualSetPointDeadband scheme the Plant Loop
requires that a Setpoint Manager that sets the high and low
setpoint values for Node%TempSetPointHi and
Node%TempSetPointLo. Examples of this setpoint manager would
be: SetpointManager:Scheduled:DualSetpoint.
Look in the Input Output Reference for the correct usage of
these SetpointManagers.
The Plant Loop Demand Calculation Scheme determines the
amount of heating or cooling necessary to bring the
temperature of the Plant Loop to its setpoint(s). When this
value is determined then the Load Distribution scheme
explained in the previous section takes this value and
distributes the load to the appropriate equipment. The demand
calculation scheme determines how the load is calculated. In
the next section is a summary of the 2 algorithms and how they
are used.
Loop
Demand Calculation Scheme SingleSetPoint[LINK]
The SingleSetPoint scheme for the PlantLoop
takes the value that is placed on the Node%TempSetPoint and
calculates the heating or cooling load necessary to obtain
that setpoint.
DeltaTemp    = LoopSetPoint - LoopTempIn
LoopDemand = mdot * Cp * DeltaTemp
The sign of the Loop Demand determines if the loop has a
cooling or heating load. Then the Load Distribution scheme
distributes this calculated load to the appropriate
equipment.
Loop
Demand Calculation Scheme DualSetPointDeadband[LINK]
The DualSetPointDeadband scheme for the PlantLoop
takes the value that is placed on the Node%TempSetPointHi and
Node%TempSetPointLo calculates the heating or cooling load
necessary to obtain that setpoint; if in the DeadBand then no
load is calculated. The pseudo code below shows the basis of
the algorithm.
            !Calculate the demand on the loop
            IF (mdot > 0.0) THEN
              LoadtoHeatingSetPoint = mdot*Cp*(LoopSetPointLo - LoopTempIn)
              LoadtoCoolingSetPoint = mdot*Cp*(LoopSetPointHi - LoopTempIn)
              ! Possible combinations:
              ! 1  LoadToHeatingSetPoint > 0 & LoadToCoolingSetPoint > 0 -->  Heating required
              ! 2  LoadToHeatingSetPoint < 0 & LoadToCoolingSetPoint < 0 -->  Cooling Required
              ! 3  LoadToHeatingSetPoint < 0 & LoadToCoolingSetPoint > 0 -->  Dead Band Operation
              ! 4  LoadToHeatingSetPoint > 0 & LoadToCoolingSetPoint < 0 -->  Not Feasible
              IF (LoadToHeatingSetPoint .GT. 0.0 .AND. LoadToCoolingSetPoint .GT. 0.0) THEN
                 LoopDemand = LoadToHeatingSetPoint
              ELSE IF (LoadToHeatingSetPoint .LT. 0.0 .AND. LoadToCoolingSetPoint .LT. 0.0) THEN
                 LoopDemand = LoadToCoolingSetPoint
              ELSE IF (LoadToHeatingSetPoint .LT. 0.0 .AND. LoadToCoolingSetPoint .GT. 0.0) THEN
                 LoopDemand = 0.0
              ELSE
                 CALL ShowSevereError
              END IF
            ELSE
              LoopDemand = 0.0
            END IF

            IF(ABS(LoopDemand) < LoopDemandTol) LoopDemand = 0.0
The sign of the Loop Demand determines if the loop has a
cooling or heating load. Then the Load Distribution scheme
distributes this calculated load to the appropriate equipment,
if there is any.
Plant
and Condenser Equipment Operation Schemes[LINK]
Plants and condenser loops must have some mechanism for
controlling the operation of the loop and which equipment is
available under different operating conditions. Once the Loop
load is calculated by the return conditions from the demand
side and using the loop setpoint, this load needs to be
allocated to the supply equipment according to the users
input. This is mainly done by the operation schemes.
Each operation scheme must have the type of operation
scheme, its identifying name, and the schedule that defines
its availability. The first scheme appearing in the list is
given the highest priority; the second scheme has second
highest priority, etc. In other words, if according to its
schedule, the first operation scheme is available, then it is
used by the simulation to define how the plant or condenser
loop operates. If it is not available, the second operation
scheme in the list is checked to see if it is available until
the highest priority scheme that is also available is found.
See the Input Output Reference for input field details.
Plant Operation Schemes[LINK]
See the Input Output Reference for input field details. The
options for plant control schemes are:
Uncontrolled Loop
Operation[LINK]
The PlantEquipmentOperation:Uncontrolled
scheme takes the full capacity of the supply equipment and
cools or heats the loop accordingly. An example would be a
cooling tower where the cooling tower would cool the condenser
loop with all of its available capacity and not be limioted by
a capacity range or setpoint. Uncontrolled loop operation
simply specifies a group of equipment that runs
‘uncontrolled’. If the loop runs, this equipment will run
also, unless turned off by the loop flow resolver to maintain
continuity in the fluid loop.
Cooling
Load Range Based Operation or Heating Load Range Based
Operation[LINK]
PlantEquipmentOperation:CoolingLoad
(or PlantEquipmentOperation:HeatingLoad) defines the different
ranges and which equipment list is valid for each range. In
each trio, there is a lower limit for the load range, an upper
limit for the load range, and a name that links to an
equipment availability list (PlantEquipmentList). Load range
operation is used when the loop load is calculated and then
the equipment is selected in the proper range. This allows for
the most efficient operation of the plant equipment or for the
user to determine the most efficient plant configuration. When
the equipment list has been deteremined then the load is
allocated to the equipment in a manner selected by the user
with “Optimal or Sequential” load distribution scheme. The
load range based operation scheme has two statements
associated with it: a main statement that defines the ranges
that individual priority settings are valid and the lists of
equipment that may be used for each range.
Condenser Operation
Schemes[LINK]
This is very similar to the plant operation schemes, but
there are several more options avaible with the CondenserLoop.
The condenser operation schemes apply to the equipment on the
‘supply side’ of the condenser loop—pumps, cooling towers,
ground coupled heat exchangers, etc. The keywords select the
algorithm that will be used to determine which equipment is
available for each time step. The ‘Range Based
Operation’ schemes select a user specified set of
equipment for each user specified range of a particular
simulation variable.’Load Range Based’ schemes
compare the demand on the condenser supply side with specified
load ranges and associated equipment lists. ’Outdoor…Range
Based’ schemes compare the current value of an
environmental parameter with user specified ranges of that
parameter. See the Input Output Reference for input field
details.
Uncontrolled Loop
Operation[LINK]
The PlantEquipmentOperation:Uncontrolled
scheme takes the full capacity of the supply equipment and
cools or heats the loop accordingly. An example would be a
cooling tower where the cooling tower would cool the condenser
loop with all of its available capacity and not be limioted by
a capacity range or setpoint. Uncontrolled loop operation
simply specifies a group of equipment that runs
‘uncontrolled’. If the loop runs, this equipment will run
also, unless turned off by the loop flow resolver to maintain
continuity in the fluid loop.
Cooling
Load Range Based Operation or Heating Load Range Based
Operation[LINK]
PlantEquipmentOperation:CoolingLoad
(or PlantEquipmentOperation:HeatingLoad) statement defines the
different ranges and which equipment list is valid for each
range. In each trio, there is a lower limit for the load
range, an upper limit for the load range, and a name that
links to an equipment availability list
(CondenserEquipmentList). Load range operation is used when
the loop load is calculated and then the equipment is selected
in the proper range. This allows for the most efficient
operation of the plant equipment or for the user to determine
the most efficient plant configuration. When the equipment
list has been deteremined then the load is allocated to the
equipment in a manner selected by the user with “Optimal or
Sequential” load distribution scheme. The load range based
operation scheme has two statements associated with it: a main
statement that defines the ranges that individual priority
settings are valid and the lists of equipment that may be used
for each range.
Outdoor
Drybulb Range Based Operation, Outdoor Wetbulb Range Based
Operation, Outdoor RHPercent Range Based Operation[LINK]
The various “PlantEquipmentOperation:Outdoor*” statements
define the different ranges of the various environmental
parameters and which equipment list is valid for each range.
After the keyword and the identifying name, a series of data
trios is expected. In each trio, there is a lower limit for
the load range, an upper limit for the load range, and a name
that links to an equipment availability list (the
“CondenserEquipmentList”).
Outdoor
Drybulb Temperature Difference Based Operation,. Outdoor
Wetbulb Temperature Difference Based Operation[LINK]
The various “PlantEquipmentOperation:Outdoor*Difference”
statements control strategies help to control any condenser
equipment based on the difference between a reference node
temperature and any environmental temperature. For example a
cooling tower can be controlled by a strategy, which looks at
the difference between the tower inlet temperature and
wet-bulb temperature. A difference range is specified for each
equipment list.
Primary-Secondary Loop
Systems[LINK]
The method to simulate a primary-secondary system in
EnergyPlus is termed Common Pipe.
Common pipe feature eliminates the need of specifying two
different EnergyPlus loops each for Primary and Secondary half
loops. Instead the user can set up the system as it is used in
real life applications. A common pipe simulation requires that
pumps be placed on both Demand (Secondary) and Supply
(Primary) sides of the loop. A typical Common Pipe layout as
used in EnergyPlus is shown in figure 92. The major
assumptions in the common pipe implementation are as
follows:
Pumps are placed on both demand and supply side of the
loop.
Secondary pump flow rate can be less than, equal to or
greater than the primary pump flow rate.
The flow at the inlet node of the half loop is equal to the
flow at the outlet node of the half loop.
The pumps can have different schedules and any loop can be
shut off when the other loop is still running.
Common pipe simulation is done during the interface update
call at both Supply-to-Demand and Demand-to-Supply.
Appropriate checks are used to make sure that the effect of
flow reversal in between iteration is taken care of. Moreover,
the common pipe keeps track of the flow rates and temperatures
at all the four nodes linked to it; namely, the inlet and
outlet nodes of each sub loop. This record will help to decide
if loops have converged or not. In situations where the
primary component meets the setpoint and the coil controls
does not change its flow request, the common pipe converges
quickly. The simple description of the control algorithm for
common Pipe implementation is as follows:
At FirstHVACiteration, the common pipe flow is initialized
to zero.
Common pipe is simulated at interfaces and thus we will
have 2 different flows handle on either side of interface.
Loops and corresponding flow rates are assigned inlet or
outlet (to common pipe) depending on the interface which calls
it. So when common pipe is called from demand to supply
interface, the inlet loop is demand side and outlet loop is
supply side and vice versa.
Inlet flow is compared to outlet flow and the difference is
set as the common pipe flow.
At each interface the common pipe flow is assigned a
direction which can be into the interface (Inlet flow <
Outlet flow) or away from interface (Inlet flow > Outlet
flow).
Outlet temperature is calculated depending on the flow rate
and flow direction. When flow is away from interface outlet
flow temperature is same as inlet flow temperature. For a
common pipe flow into the interface, the outlet flow
temperature is calculated as mixed temperature of inlet flow
and the common pipe flow.
At demand to supply interface, the supply side inlet node
temperature and flow rate are updated every iteration. At
supply to demand interface, only flow is updated. The
temperature is updated only at the end of timestep.
Loops iterate till the flow and temperatures at all the 4
concerned nodes do not change.
Two-Way Common Pipe[LINK]
A model referred to as Two-Way Common Pipe is available
which provides a way to model Primary-Secondary systems as a
single Plant Loop. In a typical EnergyPlus plant loop
simulation, the only half loop inlet/outlet node that is
controlled is the supply side outlet node. In some cases this
requirement becomes a limitation in analyzing different
options. A good example is ice thermal storage application,
where during charging phase, the coil setpoint can be
different from the ice storage equipment setpoint. With this
model, the interface between the two half loops includes two
additional flow paths that essentially split a single plant
loop into both primary and secondary loop sides. Though the
Two-Way common pipe is designed to be generic some assumptions
apply in modeling the component. The assumptions are as
follows
- The secondary flow may be less than, equal to, or greater
than the primary flow.
- The mass flow rate at the Primary Side Outlet Node is
always equal to the mass flow rate at the Primary Side Inlet
Node.
- The mass flow rate at the Secondary Side Outlet Node is
always equal to the mass flow rate at the Secondary Side Inlet
Node.
- Only one additional node, either primary-side inlet or
secondary-side inlet, (along with the primary-side/supply-side
outlet node) can be controlled. The system of equations that
describe the loop interface will be under specified if both
the Primary and Secondary Inlet nodes have to be
controlled.
Figure 115 shows a schematic of the Two-Way Common Pipe.
There are two common pipe legs, shown as broken lines, allow
for some recirculation at the half loop level. The model
allows for common pipe flow in either or both directions. The
model determines flow rates in the common pipes and
temperatures at nodes based on the following:
- Which additional node is being controlled to meet a
temperature setpoint? If the primary-side inlet node is
controlled, then the flows are controlled to deliver the
desired temperature at supply side inlet. If the
secondary-side inlet node is controlled then the flows are
controlled to deliver the desired temperature at the demand
side inlet.
- Is the specified setpoint achievable with current
secondary and primary outlet conditions? If the setpoint is
not achievable, then the flow in each common pipe leg is
reduced to its minimum possible value.
- At the controlled node, with known demand outlet
temperature, supply outlet temperature, primary flow rate and
secondary flow rate, and energy balance is used to calculate
recirculation flows in the common pipes for that particular
half loop, so that the desired temperature setpoint is
achieved.
- With a known flow in one common pipe leg, the flow on
Primary to Secondary (or secondary to primary) is easily
obtained by mass balance.
- When the Two Way Common Pipe is controlling conditions at
the secondary-side, or demand side, inlet node, then the loop
capacitance model usually used for the conditions at the
demand inlet is not used as it would interfere with
control.
Heat Recovery Loop
Systems[LINK]
Heat Recovery is accomplished by specifying another set of
supply and demand loops. Each of the heat recovery components,
i.e. engine driven and combustion turbine chillers, and
internal combustion and combustion turbine generators is
designed to use the existing component/loop/solution structure
to facilitate the simulation with the existing demand side
manager and the supply side manager. Heat recovery normally
contains components that produce heat that can be recovered,
and the ability to store or use that heat elsewhere in the
system. The component that can store the excess heat and allow
it to be used elsewhere in the system or for domestic hot
water is the Water Heater:Simple and is defined in the
Input/Output Reference.
 .
.
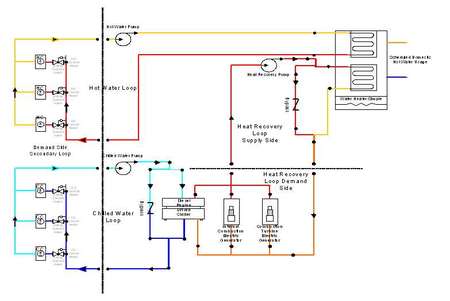
In the example above there is a chilled water Loop with
chilled water supplied by a diesel engine driven chiller.
There is a hot water Loop that is being supplied by the water
heater: simple. There is also scheduled domestic hot water
usage on the water heater which excess demand can be met by a
number of user-specified heating sources. Then on the demand
side of the heat recovery loop there is the engine driven
chiller, internal combustion, and combustion turbine electric
generators with specified mass flows to recover the heat. This
hot water is pump on the supply side by the heat recovery pump
and provides the heat to the water heater to meet the water
heater setpoint. This is probably one of the more complex
configurations and interactions that would take place in heat
recovery, but using the Plant supply and demand side
configurations this can be extended to meet most user
configurations. The plant water heater can also be used to
just meet scheduled domestic hot water use, provide a hot
water source for PlantLoop
equipment, or provide a hot water storage tank for heat
recovery as a single function. Or any combination of the above
can be configured. Example files of some of these
configurations are provided with the installation.
Plant Pressure Drop
Simulation[LINK]
As of version 4.0, there is an added feature which allows
better calculation of pressure in plant and condenser loops.
Without any method, the loops essentially ignore the node
pressures. This is suitable for many applications, however may
cause inaccuracies in the pump power. This is especially
prominent in cases where the loop flow may change drastically
over a wide range of configurations, as the pump power is
based on a rated power value and rated pump head value. As the
loop components turn on and off, the pressure drop will
change, and so the pump power should be dynamically updated
with these changes.
Overall model features:[LINK]
Calculates loop pressure drop based on pressure drop
information which is placed on branches. These are entered in
terms of generic curves (linear, quadratic) or pressure drop
information (minor loss/friction factor).
Loop pressure drop is used as the new pump head. No
information is entered about the pump curve, so it is assumed
that the pump will always be able to meet this operating
point. Future enhancements will allow the pump to ride a curve
based on the given pressure head.
Model does not resolve flow rates on parallel branches to
match pressure drop, this is explained further below, but
basically it takes the maximum pressure drop from parallel
pressure components and applies that to all parallel
components.
Model works for the following configurations:
Pump Location
Loop Pump
Branch
Pumps
Loop Types
PlantLoop
CondenserLoop
The supply side inlet (before the pump) is always set to
standard atmospheric pressure. This allows the node pressures
around the loop to stay positive. The actual values of
pressure are not all that important, it is the delta pressure
that is of interest for our calculations, but this makes the
pressure values appear realistic if one plots the pressure
around the loop.
The pressure drop is at the branch level, not the component
level. If multiple components are found on a single branch,
the pressure drop is always applied to the last component on
the branch. This is coordinated with the rule that a pump must
always be the first component if it is found on a branch.
Calculations use the branch flow rate and the branch
entering temperature to calculate properties for the whole
branch.
Detailed Restrictions:[LINK]
Pressure drop curves must not be placed on branches which
only contain a pump. Pressure curves may be placed on the
supply inlet branch with a pump as long as there are other
components on that same branch, following the pump.
If using branch pumps, pressure drop curves found on the
supply inlet branch will be ignored. Put pressure drop
information after pumps.
Currently, pressure drop simulations are not allowed with
common pipe (demand pump) simulations. A future version of the
pressure drop system will allow this by allowing each pump to
handle the pressure drop of the given loop side (demand or
supply).
Detailed Calculation
Steps:[LINK]
Before the demand side is simulated, the pressure system is
initialized. All node pressures are reset, and pressure drop
values for branches are re-initialized.
After all components on a branch are simulated, the
pressure drop for that branch is calculated. This pressure
drop is registered in the pressure drop system to be used in
subsequent loop level calculations.
Once the entire loop (demand then supply sides) is
simulated, the loop level pressure drop calculations are
performed using the following steps:
Beginning at demand side outlet (linked to supply inlet),
and working backwards, the node pressure is updated and loop
pressure is summed by “adding pressure drops” as they are
found around the loop. By working backward, we are able to
easily preserve the pump inlet pressure as a realistic value
(standard atmospheric pressure).
When a parallel system is encountered, a special operation
is performed. Since we are not resolving flows with this
version of the pressure simulation, the parallel system is set
to use the largest value of pressure drop found on the
parallel branches. In this manner, the highest pressure drop
component essentially governs the set of parallel branches,
and the other components must match the pressure drop in order
to achieve their desired flow rate. This is performed by
placing “imaginary” valves in the splitter. This allows
individual branches to report their own pressure information,
while the splitter accounts for the required pressure drop to
match the governing branch. This is shown graphically in the
figure below.
Figure 117: Explanation of valves inherently built into
Splitter object
Because the splitter automatically handles the pressure
drop required to match the pressures in the parallel system,
the mixer will have uniform flow entering from all branches
and exiting.
These calculations are performed around the loop and result
in a value of pressure drop for the entire loop.
Pump power requires a value of pressure head before it can
add heat to the loop, which is done before any components are
calculated, and any pressure system calculations are
performed. Because of this, the pump power is based on rated
head during the first iteration. On subsequent iterations, the
pump power is based on the dynamic pressure head calculated by
pressure drop information.
If anything drastically changes between one iteration and
the next, the loop will be re-simulated, and the latest value
of pressure head will be used. By the time the loop is
converged, the pressure head between the current and most
previous iterations will agree to within simulation tolerance.
Thus the pump is using a lagged value of pressure head, but
once the loop is converged, the lagged and current values will
agree.
Pressure Drop
Calculations:[LINK]
There are two types of pressure drop curves that can be
entered, each with its own calculation engine:
Generic: A curve of any form (single independent variable)
such as linear or quadratic may represent the pressure drop in
Pascals as a function of current mass flow rate in kg/s. This
is common for regressing component pressure drop such as heat
pumps into a quadratic best fit form. The branch pressure drop
is then calculated by evaluating this curve with the given
branch flow rate.
Pressure Information: This calculation involves two types
of pressure drop: frictional effects and minor losses. The
governing equation is:
The user enters value for the minor loss coefficient K to
represent all the minor losses on that branch. If the user is
entering friction information, the minor loss coefficient may
be zero or blank.
The user enters roughness, e, or a fixed value of friction
factor to account for frictional losses on the branch, as well
as an equivalent length L. If the user enters roughness then
the friction factor is calculated from a Moody chart
approximation (Haaland, 1983):
If the user enters minor loss information, then the
friction factor information can be left out.
The diameter is an equivalent value and is used to
calculate relative roughness for friction calculations as well
as velocity for any pressure drop calculation.
Riding
Pump Curves to Determine Loop Operating Point[LINK]
In addition to being able to provide a means of calculating
loop pressure drop, EnergyPlus can also perform a “loop-level”
pump-system flow resolution. The pressure drop components that
were described in the previous sections are combined with the
input of a dimensionless pump pressure-flow curve and at each
iteration, these are utilized in determining a proper
operating point for the loop.
Some restrictions do apply to this simulation. As with the
basic pressure drop simulation, common pipes are not valid in
the current release. For this pump curve phase, the simulation
is also restricted to “loop pumps” such that pumps should not
be used on the parallel branches between a mixer and
splitter.
The idea of riding a pump curve, as it is currently
implemented, is based on a constant speed pump. A variable
speed pump in EnergyPlus can already effectively vary its
flow/pressure characteristics to meet the demand. Thus, this
phase is only implemented for the Pump:ConstantSpeed
model.
The model works by approximating the loop with a quadratic
pressure drop form, then iterating to find an operating point.
The entire plant loop then iterates to find the operating
point that attempts to match the requested flows. Note that
when doing a pressure based pump simulation, the loop will
likely not hit setpoint every timestep, while doing the
simpler approach (non-pressure) may result in a
tighter-controlled simulation. In deciding this, you must
consider the realism of the pressure approach vs. the
non-pressure approach which may be more tightly controlled and
will have less input requirements.
In the first iteration of the plant, there is not yet
enough information to determine a pressure-flow simulation, so
flow through the loop is set to the rated flow rate of the
pump (irrespective of pump performance curve). For this rated
flow rate pressure drop in each branch will be calculated by
plant pressure system. So after this first pass through the
loop, the pressure system now has a valid system flow-pressure
point. From this point (pressure drop in the branch and rated
mass flow rate) a pressure constant for each branch is
calculated assuming quadratic relationship between pressure
drop and mass flow rate.
If there are parallel branches then equivalent K is
calculated from following formula.
From all these ‘K’ values of the branches a corresponding K
value for complete loop is calculated. This representative K
value for the loop will lock down a system curve for a single
iteration. This K value will change throughout the
higher-level plant iterations and simulation time steps.
The Non-dimensional pump curve is entered in following
way,
C1-4~~are curve coefficients with last mandatory
non-zero constant term C0 (as pump curve will not
pass through origin).
The nondimensional variables in the previous equation are
defined in terms of the following expressions:
Ψ – Non-dimensional pressure rise: 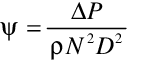
φ - Non-dimensional flow: 
The user preprocesses mass flow and pressure values into
these nondimensional forms in order to generate the curve fit.
The program then resolves the nondimensional forms into actual
values based on the pump speed, diameter, and fluid density.
This gives the proper pressure-flow relationship for the
simulation.
Pump-System
Operating Point Flow Resolver:[LINK]
The pressure drop components and the pump curve are
described in the prior sections. The routine which actually
uses these curves to resolve to an operating point is
described here. This routine is called by the pump model as it
is determining what flow it should be using. The flow resolver
reads the non-dimensional pump curve, loop pressure constant
(K value) and rated mass flow rate (or mass flow rate from
last iteration). The resolver finds the intersection of the
two curves by successive substitution with 0.9 as a damping
factor. If the flow rate is outside (or if in any iteration
move out of) the range for which pump curve-fit is suggested,
the resolver will bring the value within range, thus it is
important to specify the curve-fit range (in terms of
non-dimensional flow rate) for pump curve by the user. It was
observed that simple successive substitution (sometimes)
diverges depending on shape of curves and/or location of
operating point. Damping factor provides stability to
successive substitution and it was observed that it converges
for less number of iteration, speeding up the function. The
damping factor was set as 0.9 as it showed full stability
during testing, although a more optimum value may be available
for a particular set of curves. A future version may have an
improved selection algorithm for the damping factor
itself.
Haaland, SE. 1983. “Simple and Explicit Formulas for the
Friction Factor in Turbulent Flow”. Transactions ASIVIE,
Journal of Fluids Engineering 103: pp. 89-90.

Plant/Condenser Loops[LINK]
Integration of System and Plant[LINK]
In order to integrate the air handling system simulation with the zones simulation, methods were developed to model the system air loop and its interactions with the zones due to temperature controls and the relative difference between the zone and supply air temperatures. A similar situation is encountered when integrating the central plant simulation. Typically, the central plant interacts with the systems via a fluid loop between the plant components and heat exchangers, called either heating or cooling coils. In EnergyPlus the performance of the air systems and plant are interdependent because the simulations are combined. The plant outputs must match the system inputs and vice versa. That is, the temperature of the chilled water leaving the plant must equal the temperature of the water entering the coils, and the chilled water flow rate must satisfy mass continuity. In addition, coil controls are usually necessary to ensure that the values of chilled water flow variables entering and leaving the coil remain in a reasonable range. Plants can also interact with each other so that the operation of a chilled water loop and chiller will affect the operation of a condenser water loop.
Current Primary System Modeling Methodology[LINK]
There are two main types of loops within the HVAC simulation in EnergyPlus: an air loop and a plant loop. The air loop is assumed to use air as the transport medium as part of an air handling system while the plant loops use a liquid fluid of the user’s choosing (typically water). Condenser loops are a special case of plant loop that are for heat rejection and are distinguished by slightily different control options and applicable equipment types. A user may have any number of each type of loop in a particular input file. There are no explicit limits on the number of loops within the program—the user is only limited by computer hardware. Execution speed will naturally vary with the complexity of the input file.
Plant loops are further divided into “half-loops” or “semi-loops” for organizational clarity and simulation logistics (see Figure “Connections between the Main HVAC Simulation Loops and Half-Loops”). These sub-loops, or half-loop sides, are matched pairs that consist of half of a main plant loop. Plant loops are broken into supply and demand sides. The plant demand side half-loop contains equipment that places a load on the primary equipment. This might include coils, baseboards, radiant systems, etc. The load is met by primary equipment such as chillers or boilers on the supply side half-loop. Each supply side half-loop must be connected to a demand side half-loop and vice versa. A similar breakdown is present on condenser loops where the demand side includes the water side of chiller’s condensers while the supply side includes condenser equipment such as cooling towers.
The breakdown into two half-loops allows for better handling and control of information and simulation flow throughout the program. Direct connections between the half-loops of the air, plant, and condenser loops are enhanced by components with connections between the various main loop types. For example, coils (heating or cooling) are in reality heat exchangers with an air and a water or refrigerant side. The air side of the coil is handled within the air loop where the control of the device is also maintained. The fluid side of the coil is handled within the plant demand side, which passes the energy requirements of the coil on to the plant supply side. All loops are simulated together by successively modeling each half-loop in a particulary calling order. Overall iterations ensure that the results for the current time step are balanced and updated information has been passed to both sides of the sub-loops as well as across to the other side of air loop connections such as coils.
The plant equipment on a half-loop is described by a set of branches for that half-loop. Components can be arranged on a branch in series, and branches can be placed in parallel, with some restrictions. Figure “Branch Layout for Individual Plant Half-Loops” provides an overview of the intended branch layout for each plant half-loop. Branches are individual legs within the loop structure. Thus, the segment between point A and point B is defined as a branch, as is the section between points E and F. There may be multiple sections (C1 to D1 through Cn to Dn) in between the splitter and mixer.
Each half-loop may only have one splitter and one mixer. Thus, equipment may be in parallel between the mixer and splitter, however, within any single branch, there can only be components in series and not in parallel. The topology rules for individual half-loops allow a reasonable amount of flexibility without requiring a complicated solver routine to determine the actual flow and temperature conditions. Note that since plant supply and demand are broken up into two separate half-loops, chillers or boilers may be in parallel to each other in the supply side and coils may be in parallel to each other on the demand side. Thus, the restriction of only a single splitter and mixer on a particular half-loop does not unduly limit the allowable configurations. In some cases a single branch can be used to define an entire half-loop, but in general a half-loop should have a splitter and a mixer even if all equipment on the sub-loop is simply in series.
In addition, to avoid the need for overly complex solver routines, there are some restrictions on the placement of pumps within a particular half-loop. There are two general types of pumps, loop pumps and branch pumps. A pump that is the first component on the first branch (between A and B) is termed a “loop pump” while any pump in the parallel section (between Ci and Di) is termed a “branch pump”. The simplest and most common arrangement is to have one loop pump on the supply side inlet. In plant demand half-loops pumps can be placed only in the inlet branch. This will allow simulation of primary-secondary systems. For more information on pumps and pump placement rules, see the section on PipingSystem:Underground Simulation[LINK]
In order to simulate diverse underground piping systems, a generalized model has been implemented which allows placement of pipes in a solid medium (soil). The model simulates circuiting effects of multiple pipes by allowing fluid to flow in the pipes in different directions. The model also has the capability of simulating interaction with zone surfaces to account for things such as basement heat transfer in a foundation heat exchanger. Different aspects of the modelling approach are described in this section which can assist the user in determining if this model is appropriate for a particular application, and determining input parameter values.
An alternative interface is implemented which provides a simpler set of inputs for simulating horizontal trench heat exchangers. The key limitations of the simpler inputs include all piping in the domain being on a single circuit, all trenches equidistance apart, and each trench with the same burial depth. If this is satisfactory for an application, the GroundHeatExchanger:HorizontalTrench object is a suitable object. The object uses the same underlying simulation algorithms and data structures as the detailed piping system model, but with a simpler set of input parameters. For other cases and more detailed studies, the PipingSystem:Underground:* objects provide full flexibility.
A dual-coordinate system finite volume heat transfer model of pipes buried in a conducting medium is employed. The dual-coordinate system consists of a coarse Cartesian system in the conducting region (the soil, for example) with a refined radial system in the near-pipe region. The pipes are connected as objects on the plant loop and are simulated as needed during loop convergence, while the ground itself is only simulated once per system time step.
Approach:[LINK]
General Development and Solution Scheme[LINK]
A new heat transfer model is implemented to handle a diverse set of buried pipe conditions. The model uses a dual-coordinate system approach to solve a finite volume domain in a computationally efficient manner. The main idea behind the dual coordinate system technique is to focus the computational effort to the region where it is most needed: near the pipe(s). To this end, a coarse grid Cartesian coordinate system is used to solve the slow-moving ground heat transfer. Then, within one of these cells, a radial coordinate system is configured around the pipe/insulation with a specialized interface cell between the systems. Figure 241 shows an example of cells surrounding a pipe, including the radial region in the near-pipe cell, while Figure 242 shows a zoomed-in view of the near-pipe cell itself.
The ground heat transfer model can be set up in a fully-3D or quasi-3D manner. In either case, there is a three-dimensional grid of Cartesian cells placed in the domain. In fully-3D mode, the axial heat transfer is accounted for; in quasi-3D mode, the axial effects are ignored and the result is essentially a set of 2D slices along the length of the domain. The determination of which method will be utilized in the final model shall be based upon final testing and on a balance between accuracy vs. computation time. This option could be left to the end-user, but this will likely be unnecessary input overhead.
A fully implicit (and thus numerically stable) formulation is used to describe all cells, which means an iteration loop must be implemented. In this solver, an outer iteration loop is used to bring the entire domain to convergence, while an inner iteration loop is used over all the radial cells. This is intended to focus the computational effort even further. The outer region may converge within one or two iterations, while the “near-pipe” cells may take much more iteration. For this reason, it does not make sense to iterate over the entire domain a large number of times.
Boundary Conditions[LINK]
The farfield boundary condition is defined by a Kusuda and Achenbach (1965) correlation, which requires annual ground surface temperature data. As with the current Pipe:Underground model, the user will be able to enter the correlation parameters directly, or information from the monthly ground temperature input object will be used to infer the parameters.
The ground surface boundary condition is defined by an energy balance between the surrounding interior cells and the ground surface, including convection and radiation. As with the Pipe:Underground object, the ground surface sun exposure may be an optional input to allow for a shaded ground surface. In addition to the standard conduction, convection, and both short- and long-wave solar radiation at the surface, the ground surface boundary condition also includes the effects of evapotranspiration in the surface vegetation—the heat loss due to evaporation from soil to plant surface, and transpiration internal to the plant itself. The evapotranspiration rate is calculated as a moisture loss by using the Walter et al. (2005) model, and translated into a heat loss by multiplication with the density and latent heat of evaporation of water. The evapotranspiration rate is dependent on the type of vegetation at the surface; the user can vary the surface vegetation from anywhere between a concrete surface and a fairly tall grass (about 7”).
Based on the application, an adiabatic boundary condition will also be implemented and employed on particular surfaces of the domain. For the case where a basement or under-slab region is present, for example, an adiabatic boundary will represent the vertical line of symmetry.
“Pipe Cell” Simulation[LINK]
The ground is discretized into coarse Cartesian cells, some of which will contain a pipe. These “pipe-cells” are further discretized into a radial system with a specialized interface cell to couple these systems. The radial cells consist of a number of ground cells, with an optional insulation cell, then the pipe cell, followed by the fluid itself.
The fluid is modeled as a cylindrical cell interacting with incoming fluid and heat transfer to the pipe. When there is no flow in the system, the cell essentially becomes radially adiabatic so that the fluid temperature will float during off periods. It will not be equal to ground temperatures, unless it is off for a long time and the transient heat is allowed to dissipate. When there is flow in the system, the incoming fluid and heat transfer from the pipe wall balance with the mass of the cell to come up with a new fluid temperature for that cell, to be passed downstream to the next cell.
The fluid within the cells is modeled directionally, so that the flow can be circuited through multiple pipe segments in different directions. The flow direction in each pipe is specified by a choice field input.
Basement Interaction[LINK]
The model can also interact with basement surfaces. The interaction is split into two sections: floor surfaces and wall surfaces. For each of these, the analysis is lumped, i.e., all walls are treated as one average wall surface and all floors are treated as one average floor surface. The distance that the basement impinges within the domain is defined by a simple width and height specification. The domain is then cutaway for that region. Note that these distances then refer to the exterior surface of the wall or floor.
The ground heat transfer model does not perform any transient simulation of the basement surfaces. The transient condition through these surfaces are left to the appropriate surface heat balance algorithms. Instead, this model interacts directly at the outer boundary through the use of an OtherSideConditions model. The ground heat transfer model will take the current exterior surface heat flux and use that as the boundary for neighboring cells. Once convergence is achieved, the ground model will then effectively apply a constant surface temperature boundary condition by using a very high value of convection coefficient. The surface heat balance algorithms will then pick this up during the next zone time step.
Mesh Development[LINK]
The mesh is developed by using a few simple parameters. There are two distinct categories, the large-scale Cartesian mesh and the near-pipe refined radial mesh.
X, Y, Z mesh
Mesh Layout
Cell density
Radial mesh
Radial mesh thickness
Cell count
The Cartesian mesh uses a cell density parameter to define the number of cells to use in the simulation. Instead of requiring a detailed specification of all cell regions in the domain, this one parameter is used to specify a mesh density and is applied to all domain regions. The cell density parameter represents the number of cells within any two domain partitions. A domain partition is a basement wall or a pipe placed in the domain. Once these partitions are all laid out and validated, the regions between them are populated with the number of cells specified in the cell density parameter. Although this may lead to a variation of cell size within the domain, it is assumed that this will help focus computational intensity in the domain. Of course, the number of cells (cell density parameter) can be different for each of the X, Y, and Z directions to allow for further fine tuning of the domain.
The Cartesian mesh is laid out in either a uniform or symmetric-geometric fashion. In the former, the cells between any two domain partitions are equally sized. In the latter, the cells are smaller near the partitions to again help fine-tuning computational intensity. If the latter is selected, the amount of non-uniformity is specified by an additional parameter.
The radial coordinate system is always uniform for the soil cells, The two parameters to be specified for this region are the cell count (the number of soil cells to be generated outside of the pipe cell), and the radial mesh thickness (the radial distance from pipe outer wall to the cell boundary). Each soil cell will then have a radial thickness equal to the radial mesh thickness divided by the cell count.
Simulation Methodology[LINK]
The actual simulation of this model is performed in two parts: the ground simulation and the pipe cell simulation.
Since the ground is likely to be slow-moving and easily converging, it is simulated once per system time step. This will simulate all the cells in the domain which do not contain a pipe segment. The boundary conditions for this step are then the current surface conditions and farfield model along with the previous values for pipe cell temperature. This small lag should provide suitable accuracy as the system time step will usually be smaller than the time constant of the pipe cell. This decoupling leverages the core of the model development by again placing computational effort where it is needed most, near the pipes.
The ground simulation is performed once per time step, but the pipe cell simulation is performed at each call to the component. Each pipe will be placed on a plant loop, but not necessarily on the same plant loop or loop side. Thus, at each call to the object, that pipe will use the temperatures of the ground cells near the pipe as boundary conditions to simulate the “near-pipe” radial cells and fluid cell. In this manner, the pipes will simulate numerous times following the convergence flow of the plant loop system.
References[LINK]
Kusuda, T. & Achenbach, P. 1965. ‘Earth Temperature and Thermal Diffusivity at Selected Stations in the United States’, ASHRAE Transactions Vol. 71, Part 1, pp. 61–75.
Allen, R.G., Walter, I.A., Elliott, R.L., Howell, T.A., Itenfisu, D., Jensen, M.E., Snyder, R.L. 2005. The ASCE standardized reference evapotranspiration equation. Reston, VA:American Society of Civil Engineers. 59 p.
Pumps in this document.
Essentially, each branch is made up of one or more components linked together in series. The branch has system nodes that store properties at a location on the loop (temperature, enthalpy, flow rate, etc.) at the beginning and end of the branch as well as between components. Components on the branch take the conditions of the node at their inlet and use that information as well as overall control information to simulate the component and write the outlet data to the node following the component. This information is then used either by the next component on the branch or establishes the outlet conditions for the branch.
Although the plant model in EnergyPlus is quite flexible, in most cases the topology of the plant system in the model will be somewhat different from the topology of the actual plant system in a building. EnergyPlus is focused on modeling building energy performance over long periods of time and is not intended as a completely flexible system that can directly model any actual plant system with its full complexity and exact layout. Given the design of an actual complex plant system, the modeler will typically need to develop a simpler system that conforms to EnergyPlus’s capabilities and strives to capture the issues important for energy consumption modeling. Just like complex geometry should be simplified into thermal zones for energy models, complex plants should to be simplified into sets of pairs of closed half-loops with the allowed branch topologies.
Plant Manager[LINK]
Plant Half-Loop Calling Order[LINK]
Because there can be multiple plant loops in a model that depend on each other, one job of the plant manager is to determine an appropriate calling order for the half-loops. The intial starting calling order (and the order always used prior to EnergyPlus Version 7) is as follows:
Call all the demand side half-loops of the plant loops (in input object order)
Call all the supply side half-loops of plant loops (in input object order)
Call all the demand side half-loops of condenser loops (in input object order)
Call all the supply side half-loops of the condenser loops (in input object order).
This initial calling order is then revised during a setup phase of program execution when the plant component models are iteratively read in, initialized and sized. The algorithm is based on information provided by those component models that connect loops together. The components register that two loop-sides are connected and declare which one places demands on the other. If a half loop is connected and places demands on anther loop, then the calling order for the independent demanding loop is placed just ahead of the dependent loaded half-loop. For example a water cooled chiller component model reports that the supply side of the chilled water loop is connected to the demand side of the condenser loop and that the chilled water loop places demands on the condenser loop. The plant manger algorithm is iterative and repeatedly calls all of the half loops a total of four times. After this setup phase, the calling order is fixed for the rest of the simulation.
Plant Flow Resolver[LINK]
Overview of the Plant Flow Resolver Concept[LINK]
An important aspect of the solution procedure within plant loops is the method used to solve for the fluid flow rates throughout the various half-loops. This involves making the supply side meet a particular load and flow situation based on the simulation of the demand side loops. Load distribution is an issue that must be addressed as well as how flow rates are adjusted and temperatures are updated. These issues are discussed in the next several subsections, and the algorithms described are important to how the plant simulation functions.
In the first step, the plant loop manager calls the appropriate module to simulate (in flow order) all of the components on each branch of the loop except for splitters and mixers. In this step, each component would set the conditions at the outlet node including temperature, flow rate, maximum allowed (design) flow rate, minimum allowed (design) flow rate, maximum available flow rate, and minimum available flow rate. This would be based purely on the component’s own control scheme and thus each component would be free to request as much (or as little) flow as desired.
In the second step, the loop manager would resolve the flow at all nodes and through all branches of the local loop. The components are then simulated with the corrected flows. For this iteration, the flow resolver sets the flow rate through each loop component.
Overall Loop Flow Rate[LINK]
The plant models determine an overall fluid flow rate for each loop based on the dynamic requests and needs of the components on the loop. The flow resolver examines the requests and needs of each half-loop and chooses an overall flow rate. As individual plant components are modeled, they register their requests for fluid flow which are stored on the inlet node (variable called MassFlowRateRequest). These requests for flow are used for two purposes, overall loop flows and resolution of parallel flows inside a splitter/mixer. For determining the overall loop flow request, the requests by individual components are further qualified into three categories based on the nature of the device.
Need flow and turns loop on
Need flow if loop is already on
Take what ever flow they get.
The loop will only run at all if there are flow requests of type 1. If there are flow requests of type 2, they will not turn on the loop but may affect the overall flow rate if it is already on because of some non-zero type 1 requests. Flow requests of type 3 will not affect the overall loop flow rate. These classifications are hard coded and cannot be altered by the user.
Pump Control for Plant and Condenser Loops.[LINK]
The pump is quite simply the component that drives the flow (also see PipingSystem:Underground Simulation[LINK]
In order to simulate diverse underground piping systems, a generalized model has been implemented which allows placement of pipes in a solid medium (soil). The model simulates circuiting effects of multiple pipes by allowing fluid to flow in the pipes in different directions. The model also has the capability of simulating interaction with zone surfaces to account for things such as basement heat transfer in a foundation heat exchanger. Different aspects of the modelling approach are described in this section which can assist the user in determining if this model is appropriate for a particular application, and determining input parameter values.
An alternative interface is implemented which provides a simpler set of inputs for simulating horizontal trench heat exchangers. The key limitations of the simpler inputs include all piping in the domain being on a single circuit, all trenches equidistance apart, and each trench with the same burial depth. If this is satisfactory for an application, the GroundHeatExchanger:HorizontalTrench object is a suitable object. The object uses the same underlying simulation algorithms and data structures as the detailed piping system model, but with a simpler set of input parameters. For other cases and more detailed studies, the PipingSystem:Underground:* objects provide full flexibility.
A dual-coordinate system finite volume heat transfer model of pipes buried in a conducting medium is employed. The dual-coordinate system consists of a coarse Cartesian system in the conducting region (the soil, for example) with a refined radial system in the near-pipe region. The pipes are connected as objects on the plant loop and are simulated as needed during loop convergence, while the ground itself is only simulated once per system time step.
Approach:[LINK]
General Development and Solution Scheme[LINK]
A new heat transfer model is implemented to handle a diverse set of buried pipe conditions. The model uses a dual-coordinate system approach to solve a finite volume domain in a computationally efficient manner. The main idea behind the dual coordinate system technique is to focus the computational effort to the region where it is most needed: near the pipe(s). To this end, a coarse grid Cartesian coordinate system is used to solve the slow-moving ground heat transfer. Then, within one of these cells, a radial coordinate system is configured around the pipe/insulation with a specialized interface cell between the systems. Figure 241 shows an example of cells surrounding a pipe, including the radial region in the near-pipe cell, while Figure 242 shows a zoomed-in view of the near-pipe cell itself.
The ground heat transfer model can be set up in a fully-3D or quasi-3D manner. In either case, there is a three-dimensional grid of Cartesian cells placed in the domain. In fully-3D mode, the axial heat transfer is accounted for; in quasi-3D mode, the axial effects are ignored and the result is essentially a set of 2D slices along the length of the domain. The determination of which method will be utilized in the final model shall be based upon final testing and on a balance between accuracy vs. computation time. This option could be left to the end-user, but this will likely be unnecessary input overhead.
A fully implicit (and thus numerically stable) formulation is used to describe all cells, which means an iteration loop must be implemented. In this solver, an outer iteration loop is used to bring the entire domain to convergence, while an inner iteration loop is used over all the radial cells. This is intended to focus the computational effort even further. The outer region may converge within one or two iterations, while the “near-pipe” cells may take much more iteration. For this reason, it does not make sense to iterate over the entire domain a large number of times.
Boundary Conditions[LINK]
The farfield boundary condition is defined by a Kusuda and Achenbach (1965) correlation, which requires annual ground surface temperature data. As with the current Pipe:Underground model, the user will be able to enter the correlation parameters directly, or information from the monthly ground temperature input object will be used to infer the parameters.
The ground surface boundary condition is defined by an energy balance between the surrounding interior cells and the ground surface, including convection and radiation. As with the Pipe:Underground object, the ground surface sun exposure may be an optional input to allow for a shaded ground surface. In addition to the standard conduction, convection, and both short- and long-wave solar radiation at the surface, the ground surface boundary condition also includes the effects of evapotranspiration in the surface vegetation—the heat loss due to evaporation from soil to plant surface, and transpiration internal to the plant itself. The evapotranspiration rate is calculated as a moisture loss by using the Walter et al. (2005) model, and translated into a heat loss by multiplication with the density and latent heat of evaporation of water. The evapotranspiration rate is dependent on the type of vegetation at the surface; the user can vary the surface vegetation from anywhere between a concrete surface and a fairly tall grass (about 7”).
Based on the application, an adiabatic boundary condition will also be implemented and employed on particular surfaces of the domain. For the case where a basement or under-slab region is present, for example, an adiabatic boundary will represent the vertical line of symmetry.
“Pipe Cell” Simulation[LINK]
The ground is discretized into coarse Cartesian cells, some of which will contain a pipe. These “pipe-cells” are further discretized into a radial system with a specialized interface cell to couple these systems. The radial cells consist of a number of ground cells, with an optional insulation cell, then the pipe cell, followed by the fluid itself.
The fluid is modeled as a cylindrical cell interacting with incoming fluid and heat transfer to the pipe. When there is no flow in the system, the cell essentially becomes radially adiabatic so that the fluid temperature will float during off periods. It will not be equal to ground temperatures, unless it is off for a long time and the transient heat is allowed to dissipate. When there is flow in the system, the incoming fluid and heat transfer from the pipe wall balance with the mass of the cell to come up with a new fluid temperature for that cell, to be passed downstream to the next cell.
The fluid within the cells is modeled directionally, so that the flow can be circuited through multiple pipe segments in different directions. The flow direction in each pipe is specified by a choice field input.
Basement Interaction[LINK]
The model can also interact with basement surfaces. The interaction is split into two sections: floor surfaces and wall surfaces. For each of these, the analysis is lumped, i.e., all walls are treated as one average wall surface and all floors are treated as one average floor surface. The distance that the basement impinges within the domain is defined by a simple width and height specification. The domain is then cutaway for that region. Note that these distances then refer to the exterior surface of the wall or floor.
The ground heat transfer model does not perform any transient simulation of the basement surfaces. The transient condition through these surfaces are left to the appropriate surface heat balance algorithms. Instead, this model interacts directly at the outer boundary through the use of an OtherSideConditions model. The ground heat transfer model will take the current exterior surface heat flux and use that as the boundary for neighboring cells. Once convergence is achieved, the ground model will then effectively apply a constant surface temperature boundary condition by using a very high value of convection coefficient. The surface heat balance algorithms will then pick this up during the next zone time step.
Mesh Development[LINK]
The mesh is developed by using a few simple parameters. There are two distinct categories, the large-scale Cartesian mesh and the near-pipe refined radial mesh.
X, Y, Z mesh
Mesh Layout
Cell density
Radial mesh
Radial mesh thickness
Cell count
The Cartesian mesh uses a cell density parameter to define the number of cells to use in the simulation. Instead of requiring a detailed specification of all cell regions in the domain, this one parameter is used to specify a mesh density and is applied to all domain regions. The cell density parameter represents the number of cells within any two domain partitions. A domain partition is a basement wall or a pipe placed in the domain. Once these partitions are all laid out and validated, the regions between them are populated with the number of cells specified in the cell density parameter. Although this may lead to a variation of cell size within the domain, it is assumed that this will help focus computational intensity in the domain. Of course, the number of cells (cell density parameter) can be different for each of the X, Y, and Z directions to allow for further fine tuning of the domain.
The Cartesian mesh is laid out in either a uniform or symmetric-geometric fashion. In the former, the cells between any two domain partitions are equally sized. In the latter, the cells are smaller near the partitions to again help fine-tuning computational intensity. If the latter is selected, the amount of non-uniformity is specified by an additional parameter.
The radial coordinate system is always uniform for the soil cells, The two parameters to be specified for this region are the cell count (the number of soil cells to be generated outside of the pipe cell), and the radial mesh thickness (the radial distance from pipe outer wall to the cell boundary). Each soil cell will then have a radial thickness equal to the radial mesh thickness divided by the cell count.
Simulation Methodology[LINK]
The actual simulation of this model is performed in two parts: the ground simulation and the pipe cell simulation.
Since the ground is likely to be slow-moving and easily converging, it is simulated once per system time step. This will simulate all the cells in the domain which do not contain a pipe segment. The boundary conditions for this step are then the current surface conditions and farfield model along with the previous values for pipe cell temperature. This small lag should provide suitable accuracy as the system time step will usually be smaller than the time constant of the pipe cell. This decoupling leverages the core of the model development by again placing computational effort where it is needed most, near the pipes.
The ground simulation is performed once per time step, but the pipe cell simulation is performed at each call to the component. Each pipe will be placed on a plant loop, but not necessarily on the same plant loop or loop side. Thus, at each call to the object, that pipe will use the temperatures of the ground cells near the pipe as boundary conditions to simulate the “near-pipe” radial cells and fluid cell. In this manner, the pipes will simulate numerous times following the convergence flow of the plant loop system.
References[LINK]
Kusuda, T. & Achenbach, P. 1965. ‘Earth Temperature and Thermal Diffusivity at Selected Stations in the United States’, ASHRAE Transactions Vol. 71, Part 1, pp. 61–75.
Allen, R.G., Walter, I.A., Elliott, R.L., Howell, T.A., Itenfisu, D., Jensen, M.E., Snyder, R.L. 2005. The ASCE standardized reference evapotranspiration equation. Reston, VA:American Society of Civil Engineers. 59 p.
Pumps). How it reacts depends on several different conditions. In total, there are three different decision variables, two of which are defined by user input. These three deciding factors are whether the pump is constant or variable speed, whether the pump operation is continuous or intermittent, and whether or not there is a request for overall loop flow. After the overall loop flow request has been determined the simulation knows what the loop would like to do. The next thing it does is simulation all the loop pumps to see what the pumps can actually provide. Then the overall loop flow is bounded by the minimum and maximum that the loop pumps can provide at that time. The operation of a constant speed pump is fairly straightforward. If the user designates a constant speed pump that is operating continuously, the pump will run regardless of whether or not there is a load. This may have the net effect of adding heat to the loop if no equipment is turned on. If the pump is constant speed and operates intermittently, the pump will run at its capacity if a load is sensed and will shut off if there is no load on the loop.
A variable speed pump is defined with maximum and minimum flow rates that are the physical limits of the device. If there is no load on the loop and the pump is operating intermittently, then the pump can shutdown. For any other condition such as the loop having a load and the pump is operating intermittently or the pump is continuously operating (regardless of the loading condition), the pump will operate and select a flow somewhere between the minimum and maximum limits. In these cases where the pump is running, it will try to meet the flow request for the overall loop.
In many cases, the first estimate of flow requested by the demand side tends to be fairly accurate and the flow rate does not vary in subsequent iterations. However, because there is the possibility that the coils or some other component might request more flow in future iterations during the same time step, the program must not only set flow rates but also maintain a record of the current maximum and minimum flow rate limits. This information is important not only to the pump itself but also to other pieces of equipment which may control their flow rates and thus require knowledge of the limits within which they may work. In general, the decisions on what to set the maximum and minimum flow rates is directly related to the type of pump (constant or variable speed). For constant speed pumps, the maximum and minimum flow rate values are the same and thus if the flow requested does not match this, the other components must either deal with the flow or a bypass branch must be available to handle the excess flow. For variable speed pumps, the maximum and minimum flow rates are set by the user-defined limits.
Plant/Condenser Supply Side[LINK]
Component models, such as boilers, chillers, condensers and cooling towers are simulated on the supply side of the plant and condenser loops. In order to allow specification of realistic configurations, the plant loop managers were designed to support parallel-serial connection of component models on the loop. In addition, loop managers were designed to support both semi-deterministic models (e.g. the parameter estimation models of the ASHRAE Primary Toolkit [Pedersen 2001]) and “demand based” models (e.g. the performance map models of BLAST and DOE2.1E). As a result, the loop manager must be able to simulate models that require the mass flow rate as an input and models that calculate the mass flow rate as an output—sometimes in the context of a single loop configuration.
In order to achieve these design criteria without resorting to a pressure based flow network solver in the HVAC portion of the code, a rules-based “flow resolver” was developed for the EnergyPlus plant manager. The flow resolver is based on the following assumptions and limitations:
Each loop is only allowed to have a single splitter and a single mixer
Due to the fact that there can only be one splitter and one mixer on a given loop, it follows logically that there can be at most one bypass on each loop side
No other components may be in series with a bypass, i.e., a branch that contains a bypass may have no other equipment on that branch
Equipment may be in parallel only between the splitter and mixer components of a loop
Equipment may be hooked together in series in each branch of the loop
Flow rates on individual branches will be controlled using maximum and minimum available flow rate limits
The flow resolver employs a simple predictor-corrector algorithm to enforce mass continuity across the plant loop splitter as shown in the following figure.
As previously discussed, the pump establishes the total loop mass flow rate by setting the flow in the first supply side branch. In the second step, a predictor algorithm calls to simulate each piece of equipment on the loop and they update their mass flow rate requests based on the current flow rates, temperatures and load dispatch requests. The loop manager calls the appropriate module to simulate (in flow order) all of the components on each branch of the loop except for splitters and mixers. In this step, each component sets the conditions at its outlet node including temperature and sets component flows on the inlet node. Each component and branch is classified for their type of flow control. Prior to version 7 this was input by the user where branch objects were tagged in the user input file as an ACTIVE, SERIESACTIVE, PASSIVE or BYPASS type of model. As of version 7 this has been hard coded and the input is no longer used. An ACTIVE flow control type describes a demand based plant model that calculates mass flow rate as an output. An ACTIVE component when OFF will shut down the whole branch irrespective of the type of other components on the branch. A SERIESACTIVE branch is like an ACTIVE component except that there are more than one ACTIVE components on the branch so that two components requests may be at odds with each other and so it might not shut down the whole branch when the component is OFF. The flow resolution algorithm is same for both ACTIVE and SERIESACTIVE components and in the rest of the document description of one type will fit the other type too. A PASSIVE type describes a semi-deterministic model that is simulated with the mass flow rate as an input. The BYPASS type designates a loop bypass.
The predictor algorithm first establishes the desired flow rate of each branch by searching for ACTIVE components on the branch. The first ACTIVE component in simulation order sets the desired branch flow. Branches with only PASSIVE components require a flow rate between the minimum and maximum allowable branch flow. Branches with a BYPASS component have a branch flow only when all other branches combined cannot handle the entire loop flow.
The loop flow resolver makes any necessary “corrections” to the requested branch flows in order to enforce overall continuity on the loop. If mass conservation allows all ACTIVE branches to be satisfied, then the remaining flow is divided between the PASSIVE branches and as a last resort, the BYPASS. If there is insufficient flow to meet the branch demand, ACTIVE branch requests are met first in the order that the branches appear in the branch list in the input file.
The flow rate is resolved first for each individual branch. For every branch, the program cycles through each node on the branch and determines what the flow requests and flow limits are. The most restrictive flow constraints are assumed to be valid for the entire branch regardless of component type. Active components are given highest priority for requesting a particular flow rate. If there is more than one active component on a particular branch, then it is assumed that the active component on the branch with the highest flow request dictates the flow request for the entire branch.
Once all of the branches have set their flow rates and constraints, the splitter and mixer must resolve the various flow requests. The mixer and any branch following the mixer is passive. Thus, all of the flow control happens at the splitter. The splitter first attempts to sum the maximum and minimum constraints from all of the active branches coming out of the device and compares those to the constraints that are valid for the branch leading into the splitter. When there is a mismatch between the outlet constraints and the inlet constraints, the simulation will defer to the inlet constraints due to the fact that the pump is in reality controlling flow on the loop. Since the constraints of the pump would be passed across to the demand side from the supply side, an assumption is made that the coils or other demand side components must live within the bounds of the pump.
Once the flow has been resolved at the splitter, the branch flow rates and constraints between the splitter and mixer can be adjusted, if necessary. In some cases, this will be mandatory to maintain a mass balance at the splitter. When the flow rate coming out of the splitter does not match the active branch requests, individual branch flow rates must be adjusted to provide for the extra flow or the “flow deficit”. When there is extra flow, the excess flow is sent through any bypass branch first and then is sent to passive branches in reverse order of their appearance in the splitter outlet list. When all of these branches have been exhausted and there is still excess flow, flow will be increased to the active branches, also in reverse order. The reverse order guarantees that the branch appearing first has the highest priority to receive the flow rate it has requested.
if there is not enough flow to meet all active branch requests (i.e., a “flow deficit”), then the flow rates through the bypass and passive branches are set to zero. The flow rates through the active branches will then be decreased in reverse order until the splitter outlet flow rate matches the available flow at the splitter inlet. For a plant loop flow deficit, the bypass and passive branch flows are also set to zero, and flow rates for each active branch are calculated as follows:
where:
It is also necessary to monitor the flow constraints at the branches and components since once the flow rates are changed, the components must be resimulated by the controlling loop (air loop, zone equipment, or plant supply side). The controllers for these components must know if the constraints have been modified so that the simulation does not toggle between a component requesting a flow that the pump cannot meet and the pump then resetting the flow to what it can provide. Note that once a flow rate for any component has changed that this signals the need to resimulate any sub-loop to which it might have an indirect connection. Currently, this means that if a flow rate on the plant demand side changes, the simulation must recalculate the conditions on both the air loop and zone equipment sub-loops since coils and other equipment could be on either side of the main air loop. Similarly, if the condenser demand side simulation results in a change in flow rate through a chiller condenser, then the plant supply side must be triggered to perform its calculations again. Care has been taken to avoid cases where the various half-loops might simply keep triggering the resimulation of their indirect connections in an infinite loop.
Loop Capacitance and Pump Heat[LINK]
The plant model includes simplified methods of modeling fluid capacitance and the temperature rise because of pumping and friction. The transition from load or energy based plant models to a loop based arrangement makes variables of both the flow rate and the fluid temperature. This means there are more degrees of freedom that must be controlled. The flow resolver concept discussed previously controls the fluid flow rates through the components and maintains an overall mass flow balance through the loop. However, the temperatures still need to be controlled and modeled. A purely iterative procedure can be expected to converge to the appropriate loop temperatures, but the procedure can become slow to converge under conditions where the demand changes rapidly or the supply components may not have enough capacity to meet the system demand. This situation is somewhat analogous to that existing in the link between the zone and the air system. In that case, the convergence and stability of the iterative solution was greatly improved by adding the thermal capacitance of the zone air and other fast responding mass within the zone. Based on that experience, it was decided to add thermal capacitance to the plant loop model to benefit from the added stability. Because the thermal capacitance in the zone/system interaction is relatively small, it was necessary to use a third order numerical solution there. Although the plant loop’s fluid thermal capacitance is relatively high, the fluid flows also have high heat capacity and can change temperatures rapidly a simple first order solution was not found to be satisfactory and an exact analytical solution was needed.
In realistic conditions there is often some delay between changes in supply conditions and corresponding changes at demand side components due to the transport of fluid round the loop having a finite velocity.
The act of pumping fluid around a loop adds heat to the fluid through friction. The slight warming occurs at the pump and all around the circuit. The amount of heat is equal to the work done on the fluid by the pump. This so-called pump heat is a complicating factor in plant simulation because the pump heat alters the load on primary equipment. A simple method of accounting for pumping heat is needed that doesn’t increase the difficulties of the numerical solution and (as of version 7) in EnergyPlus this accomplished by including the pump heat in the loop capacitance model.
Plant loops include a simple loop capacitance model to simulate these effects based on a well-stirred tank model. Each half-loop has a well-stirred tank located at its inlet as indicated in Figure 112. The temperature of the tank is modeled as a function of the tank mass, inlet fluid flow rate and temperature, and pump heat. No energy is lost or gained because of storage in the loop capacitance.
The total plant loop volume is separated into two tanks, on on each half-loop inlet. For normal loops (without common pipes) each tank is one half of the plant loop volume. For common pipe plant loops, the tank on the supply side inlet has three fourths of the volume and the tank on the demand side inlet has one fourth. Each plant loop is assigned a total fluid volume as user input or an autocalculate routine based on the design flow rate. The size of the thermal capacitance affects the speed of recovery from situations where the setpoint was not maintained. The user must estimate a fluid volume based on the size of the pipes in the loop. Note that rough estimates seem to be sufficient. Loop capacitance (m3) could be calculated from pipe size data but this is not usually known. If zero capacitance is specified the above formulation reduces to an instantaneous update in demand update temperature and the demand inlet temperature becomes the supply outlet temperature at the previous time step. If a very large capacitance is specified unrealistic time delay may result and there may be poor response to changes in loop setpoint temperature. The loop capacitance ‘autocalculate’ option gives reasonable values and is calculated as follows,
The tank temperature is modeled by drawing a control volume and energy balance around the tank and solving for the temperature. The temperature of each tank is recalculated whenever the two half-loops are interfaced together. The tank temperature history is stored at the end of the simulation timestep. The model equation for tank (and outlet temperature) is formulated as follows:
The tank temperature at the end of the simulation timestep is solved by the analytical approach and expressed as
where:
When modeling plants using one of the common pipe modes for plant loops, the same tank model is used but the tanks are situated differently and account for extra connections. For common pipe situation, the tanks are located on the outlet of a half loop with common pipe interactions downstream of the tank.
The average temperature is reported as the tank temperature. The average temperature is defined as the value of an integral function of tank temperature on an interval [0,δt]
Plant Flow Resolver Input[LINK]
The input specifically related to the flow resolver consists of the plant BranchList and the plant ConnectorList as shown in the Input Output Reference. User defined names link the plant loop to its branches (contained in the BranchList) and define the loop splitters and mixers contained in the ConnectorList. The Connector:Splitter and Connector:Mixer syntax in turn define the relative connection of the branches to each other on the loop.
The Branch definition is input in simulation and connection order for all of the components on the branch. The simulation assumes that the inlet node of the first component listed on the branch is the branch inlet node and the outlet node of the last component listed on the branch is the branch outlet node. Examples of all the input syntax is shown in the Input/Output Reference for the appropriate object.
Summary of Load Distribution Schemes[LINK]
Three load distribution schemes are employed in EnergyPlus. The figure below illustrates the plant load distribution algorithm. The total loop demand is calculated and used in the ManagePlantLoopOperation routine to determine which equipment is available based on the supervisory control scheme specified by the user. Once all available components have been identified the loop demand is distributed to the available components based on the user specified load distribution scheme.
The OPTIMAL scheme first loads each component to its optimal part load ratio (specified in input). Any remaining loop demand is distributed evenly to all the components. The SEQUENTIAL scheme loads each component one at a time to capacity until the loop demand is met. The components are loaded up in the order that they appear in the equipment list specified in input. The UNIFORM scheme first divides the load evenly among all available components. If some components do not have the capacity to meet the uniformly distributed load, the remaining load is divided among the remaining components.
Summary of Plant Loop Demand Calculation Schemes[LINK]
There are two plant loop demand calculations schemes in EnergyPlus. There is a SingleSetPoint and a DualSetPointDeadband; the SingleSetPoint is the default if that field is left blank in the PlantLoop object. In the SingleSetPoint scheme the Plant Loop requires that a Setpoint Manager set a single setpoint value that sets Node%TempSetPoint. Examples of this Setpoint Manager would be: the objects SetpointManager:Scheduled, SetpointManager:OutdoorAirReset, etc. For the DualSetPointDeadband scheme the Plant Loop requires that a Setpoint Manager that sets the high and low setpoint values for Node%TempSetPointHi and Node%TempSetPointLo. Examples of this setpoint manager would be: SetpointManager:Scheduled:DualSetpoint. Look in the Input Output Reference for the correct usage of these SetpointManagers.
The Plant Loop Demand Calculation Scheme determines the amount of heating or cooling necessary to bring the temperature of the Plant Loop to its setpoint(s). When this value is determined then the Load Distribution scheme explained in the previous section takes this value and distributes the load to the appropriate equipment. The demand calculation scheme determines how the load is calculated. In the next section is a summary of the 2 algorithms and how they are used.
Loop Demand Calculation Scheme SingleSetPoint[LINK]
The SingleSetPoint scheme for the PlantLoop takes the value that is placed on the Node%TempSetPoint and calculates the heating or cooling load necessary to obtain that setpoint.
The sign of the Loop Demand determines if the loop has a cooling or heating load. Then the Load Distribution scheme distributes this calculated load to the appropriate equipment.
Loop Demand Calculation Scheme DualSetPointDeadband[LINK]
The DualSetPointDeadband scheme for the PlantLoop takes the value that is placed on the Node%TempSetPointHi and Node%TempSetPointLo calculates the heating or cooling load necessary to obtain that setpoint; if in the DeadBand then no load is calculated. The pseudo code below shows the basis of the algorithm.
The sign of the Loop Demand determines if the loop has a cooling or heating load. Then the Load Distribution scheme distributes this calculated load to the appropriate equipment, if there is any.
Plant and Condenser Equipment Operation Schemes[LINK]
Plants and condenser loops must have some mechanism for controlling the operation of the loop and which equipment is available under different operating conditions. Once the Loop load is calculated by the return conditions from the demand side and using the loop setpoint, this load needs to be allocated to the supply equipment according to the users input. This is mainly done by the operation schemes.
Each operation scheme must have the type of operation scheme, its identifying name, and the schedule that defines its availability. The first scheme appearing in the list is given the highest priority; the second scheme has second highest priority, etc. In other words, if according to its schedule, the first operation scheme is available, then it is used by the simulation to define how the plant or condenser loop operates. If it is not available, the second operation scheme in the list is checked to see if it is available until the highest priority scheme that is also available is found. See the Input Output Reference for input field details.
Plant Operation Schemes[LINK]
See the Input Output Reference for input field details. The options for plant control schemes are:
Uncontrolled Loop Operation[LINK]
The PlantEquipmentOperation:Uncontrolled scheme takes the full capacity of the supply equipment and cools or heats the loop accordingly. An example would be a cooling tower where the cooling tower would cool the condenser loop with all of its available capacity and not be limioted by a capacity range or setpoint. Uncontrolled loop operation simply specifies a group of equipment that runs ‘uncontrolled’. If the loop runs, this equipment will run also, unless turned off by the loop flow resolver to maintain continuity in the fluid loop.
Cooling Load Range Based Operation or Heating Load Range Based Operation[LINK]
PlantEquipmentOperation:CoolingLoad (or PlantEquipmentOperation:HeatingLoad) defines the different ranges and which equipment list is valid for each range. In each trio, there is a lower limit for the load range, an upper limit for the load range, and a name that links to an equipment availability list (PlantEquipmentList). Load range operation is used when the loop load is calculated and then the equipment is selected in the proper range. This allows for the most efficient operation of the plant equipment or for the user to determine the most efficient plant configuration. When the equipment list has been deteremined then the load is allocated to the equipment in a manner selected by the user with “Optimal or Sequential” load distribution scheme. The load range based operation scheme has two statements associated with it: a main statement that defines the ranges that individual priority settings are valid and the lists of equipment that may be used for each range.
Condenser Operation Schemes[LINK]
This is very similar to the plant operation schemes, but there are several more options avaible with the CondenserLoop. The condenser operation schemes apply to the equipment on the ‘supply side’ of the condenser loop—pumps, cooling towers, ground coupled heat exchangers, etc. The keywords select the algorithm that will be used to determine which equipment is available for each time step. The ‘Range Based Operation’ schemes select a user specified set of equipment for each user specified range of a particular simulation variable.’Load Range Based’ schemes compare the demand on the condenser supply side with specified load ranges and associated equipment lists. ’Outdoor…Range Based’ schemes compare the current value of an environmental parameter with user specified ranges of that parameter. See the Input Output Reference for input field details.
Uncontrolled Loop Operation[LINK]
The PlantEquipmentOperation:Uncontrolled scheme takes the full capacity of the supply equipment and cools or heats the loop accordingly. An example would be a cooling tower where the cooling tower would cool the condenser loop with all of its available capacity and not be limioted by a capacity range or setpoint. Uncontrolled loop operation simply specifies a group of equipment that runs ‘uncontrolled’. If the loop runs, this equipment will run also, unless turned off by the loop flow resolver to maintain continuity in the fluid loop.
Cooling Load Range Based Operation or Heating Load Range Based Operation[LINK]
PlantEquipmentOperation:CoolingLoad (or PlantEquipmentOperation:HeatingLoad) statement defines the different ranges and which equipment list is valid for each range. In each trio, there is a lower limit for the load range, an upper limit for the load range, and a name that links to an equipment availability list (CondenserEquipmentList). Load range operation is used when the loop load is calculated and then the equipment is selected in the proper range. This allows for the most efficient operation of the plant equipment or for the user to determine the most efficient plant configuration. When the equipment list has been deteremined then the load is allocated to the equipment in a manner selected by the user with “Optimal or Sequential” load distribution scheme. The load range based operation scheme has two statements associated with it: a main statement that defines the ranges that individual priority settings are valid and the lists of equipment that may be used for each range.
Outdoor Drybulb Range Based Operation, Outdoor Wetbulb Range Based Operation, Outdoor RHPercent Range Based Operation[LINK]
The various “PlantEquipmentOperation:Outdoor*” statements define the different ranges of the various environmental parameters and which equipment list is valid for each range. After the keyword and the identifying name, a series of data trios is expected. In each trio, there is a lower limit for the load range, an upper limit for the load range, and a name that links to an equipment availability list (the “CondenserEquipmentList”).
Outdoor Drybulb Temperature Difference Based Operation,. Outdoor Wetbulb Temperature Difference Based Operation[LINK]
The various “PlantEquipmentOperation:Outdoor*Difference” statements control strategies help to control any condenser equipment based on the difference between a reference node temperature and any environmental temperature. For example a cooling tower can be controlled by a strategy, which looks at the difference between the tower inlet temperature and wet-bulb temperature. A difference range is specified for each equipment list.
Primary-Secondary Loop Systems[LINK]
The method to simulate a primary-secondary system in EnergyPlus is termed Common Pipe.
Common Pipe[LINK]
Common pipe feature eliminates the need of specifying two different EnergyPlus loops each for Primary and Secondary half loops. Instead the user can set up the system as it is used in real life applications. A common pipe simulation requires that pumps be placed on both Demand (Secondary) and Supply (Primary) sides of the loop. A typical Common Pipe layout as used in EnergyPlus is shown in figure 92. The major assumptions in the common pipe implementation are as follows:
Pumps are placed on both demand and supply side of the loop.
Secondary pump flow rate can be less than, equal to or greater than the primary pump flow rate.
The flow at the inlet node of the half loop is equal to the flow at the outlet node of the half loop.
The pumps can have different schedules and any loop can be shut off when the other loop is still running.
Common pipe simulation is done during the interface update call at both Supply-to-Demand and Demand-to-Supply. Appropriate checks are used to make sure that the effect of flow reversal in between iteration is taken care of. Moreover, the common pipe keeps track of the flow rates and temperatures at all the four nodes linked to it; namely, the inlet and outlet nodes of each sub loop. This record will help to decide if loops have converged or not. In situations where the primary component meets the setpoint and the coil controls does not change its flow request, the common pipe converges quickly. The simple description of the control algorithm for common Pipe implementation is as follows:
At FirstHVACiteration, the common pipe flow is initialized to zero.
Common pipe is simulated at interfaces and thus we will have 2 different flows handle on either side of interface.
Loops and corresponding flow rates are assigned inlet or outlet (to common pipe) depending on the interface which calls it. So when common pipe is called from demand to supply interface, the inlet loop is demand side and outlet loop is supply side and vice versa.
Inlet flow is compared to outlet flow and the difference is set as the common pipe flow.
At each interface the common pipe flow is assigned a direction which can be into the interface (Inlet flow < Outlet flow) or away from interface (Inlet flow > Outlet flow).
Outlet temperature is calculated depending on the flow rate and flow direction. When flow is away from interface outlet flow temperature is same as inlet flow temperature. For a common pipe flow into the interface, the outlet flow temperature is calculated as mixed temperature of inlet flow and the common pipe flow.
At demand to supply interface, the supply side inlet node temperature and flow rate are updated every iteration. At supply to demand interface, only flow is updated. The temperature is updated only at the end of timestep.
Loops iterate till the flow and temperatures at all the 4 concerned nodes do not change.
Two-Way Common Pipe[LINK]
A model referred to as Two-Way Common Pipe is available which provides a way to model Primary-Secondary systems as a single Plant Loop. In a typical EnergyPlus plant loop simulation, the only half loop inlet/outlet node that is controlled is the supply side outlet node. In some cases this requirement becomes a limitation in analyzing different options. A good example is ice thermal storage application, where during charging phase, the coil setpoint can be different from the ice storage equipment setpoint. With this model, the interface between the two half loops includes two additional flow paths that essentially split a single plant loop into both primary and secondary loop sides. Though the Two-Way common pipe is designed to be generic some assumptions apply in modeling the component. The assumptions are as follows
Figure 115 shows a schematic of the Two-Way Common Pipe. There are two common pipe legs, shown as broken lines, allow for some recirculation at the half loop level. The model allows for common pipe flow in either or both directions. The model determines flow rates in the common pipes and temperatures at nodes based on the following:
Heat Recovery Loop Systems[LINK]
Heat Recovery is accomplished by specifying another set of supply and demand loops. Each of the heat recovery components, i.e. engine driven and combustion turbine chillers, and internal combustion and combustion turbine generators is designed to use the existing component/loop/solution structure to facilitate the simulation with the existing demand side manager and the supply side manager. Heat recovery normally contains components that produce heat that can be recovered, and the ability to store or use that heat elsewhere in the system. The component that can store the excess heat and allow it to be used elsewhere in the system or for domestic hot water is the Water Heater:Simple and is defined in the Input/Output Reference.
In the example above there is a chilled water Loop with chilled water supplied by a diesel engine driven chiller. There is a hot water Loop that is being supplied by the water heater: simple. There is also scheduled domestic hot water usage on the water heater which excess demand can be met by a number of user-specified heating sources. Then on the demand side of the heat recovery loop there is the engine driven chiller, internal combustion, and combustion turbine electric generators with specified mass flows to recover the heat. This hot water is pump on the supply side by the heat recovery pump and provides the heat to the water heater to meet the water heater setpoint. This is probably one of the more complex configurations and interactions that would take place in heat recovery, but using the Plant supply and demand side configurations this can be extended to meet most user configurations. The plant water heater can also be used to just meet scheduled domestic hot water use, provide a hot water source for PlantLoop equipment, or provide a hot water storage tank for heat recovery as a single function. Or any combination of the above can be configured. Example files of some of these configurations are provided with the installation.
Plant Pressure Drop Simulation[LINK]
As of version 4.0, there is an added feature which allows better calculation of pressure in plant and condenser loops. Without any method, the loops essentially ignore the node pressures. This is suitable for many applications, however may cause inaccuracies in the pump power. This is especially prominent in cases where the loop flow may change drastically over a wide range of configurations, as the pump power is based on a rated power value and rated pump head value. As the loop components turn on and off, the pressure drop will change, and so the pump power should be dynamically updated with these changes.
Overall model features:[LINK]
Calculates loop pressure drop based on pressure drop information which is placed on branches. These are entered in terms of generic curves (linear, quadratic) or pressure drop information (minor loss/friction factor).
Loop pressure drop is used as the new pump head. No information is entered about the pump curve, so it is assumed that the pump will always be able to meet this operating point. Future enhancements will allow the pump to ride a curve based on the given pressure head.
Model does not resolve flow rates on parallel branches to match pressure drop, this is explained further below, but basically it takes the maximum pressure drop from parallel pressure components and applies that to all parallel components.
Model works for the following configurations:
Pump Location
Loop Pump
Branch Pumps
Loop Types
PlantLoop
CondenserLoop
The supply side inlet (before the pump) is always set to standard atmospheric pressure. This allows the node pressures around the loop to stay positive. The actual values of pressure are not all that important, it is the delta pressure that is of interest for our calculations, but this makes the pressure values appear realistic if one plots the pressure around the loop.
The pressure drop is at the branch level, not the component level. If multiple components are found on a single branch, the pressure drop is always applied to the last component on the branch. This is coordinated with the rule that a pump must always be the first component if it is found on a branch.
Calculations use the branch flow rate and the branch entering temperature to calculate properties for the whole branch.
Detailed Restrictions:[LINK]
Pressure drop curves must not be placed on branches which only contain a pump. Pressure curves may be placed on the supply inlet branch with a pump as long as there are other components on that same branch, following the pump.
If using branch pumps, pressure drop curves found on the supply inlet branch will be ignored. Put pressure drop information after pumps.
Currently, pressure drop simulations are not allowed with common pipe (demand pump) simulations. A future version of the pressure drop system will allow this by allowing each pump to handle the pressure drop of the given loop side (demand or supply).
Detailed Calculation Steps:[LINK]
Before the demand side is simulated, the pressure system is initialized. All node pressures are reset, and pressure drop values for branches are re-initialized.
After all components on a branch are simulated, the pressure drop for that branch is calculated. This pressure drop is registered in the pressure drop system to be used in subsequent loop level calculations.
Once the entire loop (demand then supply sides) is simulated, the loop level pressure drop calculations are performed using the following steps:
Beginning at demand side outlet (linked to supply inlet), and working backwards, the node pressure is updated and loop pressure is summed by “adding pressure drops” as they are found around the loop. By working backward, we are able to easily preserve the pump inlet pressure as a realistic value (standard atmospheric pressure).
When a parallel system is encountered, a special operation is performed. Since we are not resolving flows with this version of the pressure simulation, the parallel system is set to use the largest value of pressure drop found on the parallel branches. In this manner, the highest pressure drop component essentially governs the set of parallel branches, and the other components must match the pressure drop in order to achieve their desired flow rate. This is performed by placing “imaginary” valves in the splitter. This allows individual branches to report their own pressure information, while the splitter accounts for the required pressure drop to match the governing branch. This is shown graphically in the figure below.
Figure 117: Explanation of valves inherently built into Splitter object
Because the splitter automatically handles the pressure drop required to match the pressures in the parallel system, the mixer will have uniform flow entering from all branches and exiting.
These calculations are performed around the loop and result in a value of pressure drop for the entire loop.
Pump power requires a value of pressure head before it can add heat to the loop, which is done before any components are calculated, and any pressure system calculations are performed. Because of this, the pump power is based on rated head during the first iteration. On subsequent iterations, the pump power is based on the dynamic pressure head calculated by pressure drop information.
If anything drastically changes between one iteration and the next, the loop will be re-simulated, and the latest value of pressure head will be used. By the time the loop is converged, the pressure head between the current and most previous iterations will agree to within simulation tolerance. Thus the pump is using a lagged value of pressure head, but once the loop is converged, the lagged and current values will agree.
Pressure Drop Calculations:[LINK]
There are two types of pressure drop curves that can be entered, each with its own calculation engine:
Generic: A curve of any form (single independent variable) such as linear or quadratic may represent the pressure drop in Pascals as a function of current mass flow rate in kg/s. This is common for regressing component pressure drop such as heat pumps into a quadratic best fit form. The branch pressure drop is then calculated by evaluating this curve with the given branch flow rate.
Pressure Information: This calculation involves two types of pressure drop: frictional effects and minor losses. The governing equation is:
The user enters value for the minor loss coefficient K to represent all the minor losses on that branch. If the user is entering friction information, the minor loss coefficient may be zero or blank.
The user enters roughness, e, or a fixed value of friction factor to account for frictional losses on the branch, as well as an equivalent length L. If the user enters roughness then the friction factor is calculated from a Moody chart approximation (Haaland, 1983):
If the user enters minor loss information, then the friction factor information can be left out.
The diameter is an equivalent value and is used to calculate relative roughness for friction calculations as well as velocity for any pressure drop calculation.
Riding Pump Curves to Determine Loop Operating Point[LINK]
In addition to being able to provide a means of calculating loop pressure drop, EnergyPlus can also perform a “loop-level” pump-system flow resolution. The pressure drop components that were described in the previous sections are combined with the input of a dimensionless pump pressure-flow curve and at each iteration, these are utilized in determining a proper operating point for the loop.
Some restrictions do apply to this simulation. As with the basic pressure drop simulation, common pipes are not valid in the current release. For this pump curve phase, the simulation is also restricted to “loop pumps” such that pumps should not be used on the parallel branches between a mixer and splitter.
The idea of riding a pump curve, as it is currently implemented, is based on a constant speed pump. A variable speed pump in EnergyPlus can already effectively vary its flow/pressure characteristics to meet the demand. Thus, this phase is only implemented for the Pump:ConstantSpeed model.
The model works by approximating the loop with a quadratic pressure drop form, then iterating to find an operating point. The entire plant loop then iterates to find the operating point that attempts to match the requested flows. Note that when doing a pressure based pump simulation, the loop will likely not hit setpoint every timestep, while doing the simpler approach (non-pressure) may result in a tighter-controlled simulation. In deciding this, you must consider the realism of the pressure approach vs. the non-pressure approach which may be more tightly controlled and will have less input requirements.
In the first iteration of the plant, there is not yet enough information to determine a pressure-flow simulation, so flow through the loop is set to the rated flow rate of the pump (irrespective of pump performance curve). For this rated flow rate pressure drop in each branch will be calculated by plant pressure system. So after this first pass through the loop, the pressure system now has a valid system flow-pressure point. From this point (pressure drop in the branch and rated mass flow rate) a pressure constant for each branch is calculated assuming quadratic relationship between pressure drop and mass flow rate.
If there are parallel branches then equivalent K is calculated from following formula.
From all these ‘K’ values of the branches a corresponding K value for complete loop is calculated. This representative K value for the loop will lock down a system curve for a single iteration. This K value will change throughout the higher-level plant iterations and simulation time steps.
The Non-dimensional pump curve is entered in following way,
C1-4~~are curve coefficients with last mandatory non-zero constant term C0 (as pump curve will not pass through origin).
The nondimensional variables in the previous equation are defined in terms of the following expressions:
Ψ – Non-dimensional pressure rise:
φ - Non-dimensional flow:
The user preprocesses mass flow and pressure values into these nondimensional forms in order to generate the curve fit. The program then resolves the nondimensional forms into actual values based on the pump speed, diameter, and fluid density. This gives the proper pressure-flow relationship for the simulation.
Pump-System Operating Point Flow Resolver:[LINK]
The pressure drop components and the pump curve are described in the prior sections. The routine which actually uses these curves to resolve to an operating point is described here. This routine is called by the pump model as it is determining what flow it should be using. The flow resolver reads the non-dimensional pump curve, loop pressure constant (K value) and rated mass flow rate (or mass flow rate from last iteration). The resolver finds the intersection of the two curves by successive substitution with 0.9 as a damping factor. If the flow rate is outside (or if in any iteration move out of) the range for which pump curve-fit is suggested, the resolver will bring the value within range, thus it is important to specify the curve-fit range (in terms of non-dimensional flow rate) for pump curve by the user. It was observed that simple successive substitution (sometimes) diverges depending on shape of curves and/or location of operating point. Damping factor provides stability to successive substitution and it was observed that it converges for less number of iteration, speeding up the function. The damping factor was set as 0.9 as it showed full stability during testing, although a more optimum value may be available for a particular set of curves. A future version may have an improved selection algorithm for the damping factor itself.
References[LINK]
Haaland, SE. 1983. “Simple and Explicit Formulas for the Friction Factor in Turbulent Flow”. Transactions ASIVIE, Journal of Fluids Engineering 103: pp. 89-90.
Documentation content copyright © 1996-2026 The Board of Trustees of the University of Illinois and the Regents of the University of California through the Ernest Orlando Lawrence Berkeley National Laboratory. All rights reserved. EnergyPlus is a trademark of the US Department of Energy.
This documentation is made available under the EnergyPlus Open Source License v1.0.