Document Window
The Document Window is the centerpiece of the Elements user interface. It represents a single weather file comprised of header data and 8760 rows of hourly time-series data.
The header data include values for (among others):
- Latitude
- Longitude
- Time zone
- Elevation.
The time-series data include variables for (among others):
- Psychrometrics (temperature, humidity, pressure, density, enthalpy)
- Solar (global, normal, diffuse, solar angles)
- Wind (speed and direction).
From the Document Window, you can view and edit all of the header and time-series data. You can edit individual values or edit selections of data in bulk. You can also access all menu commands.
Multiple weather files can be open at the same time in separate Document Windows.
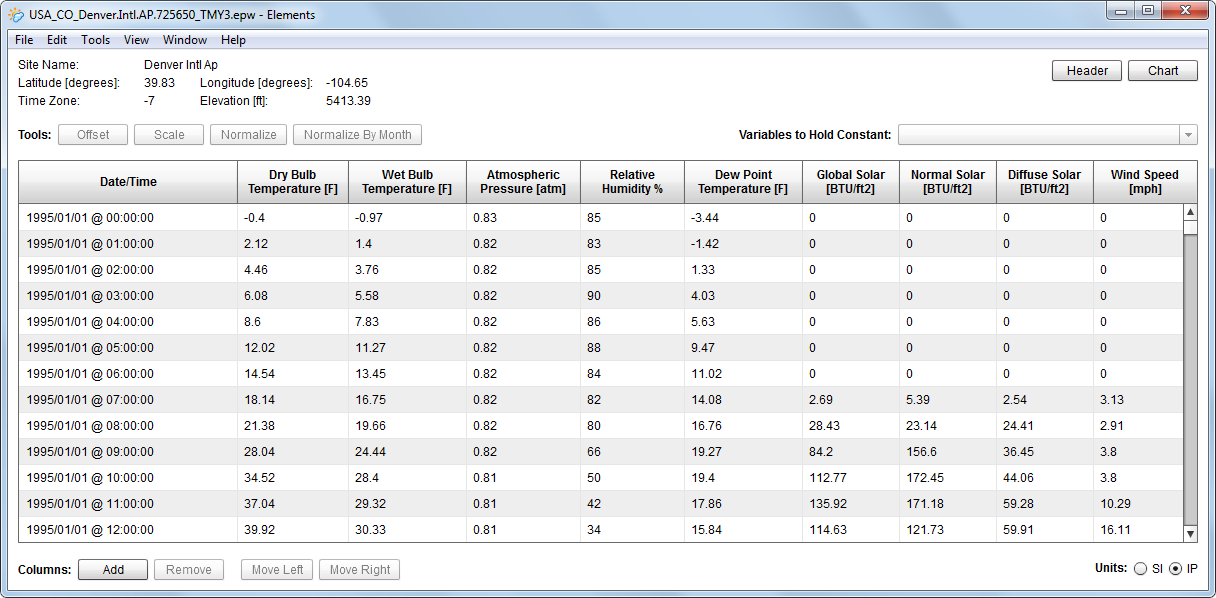
The different parts of the Document Window are described below.
Header Summary
The upper left of the Document Window displays a summary of data from the header including site name, latitude, longitude, time zone, and elevation.
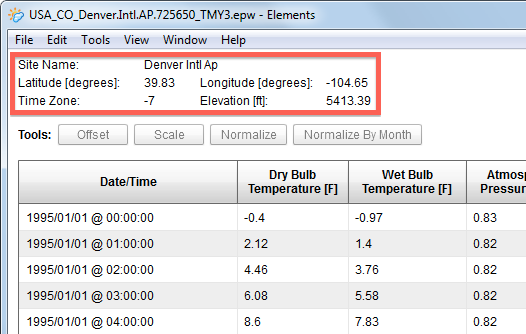
These values and other header data can be viewed and edited in the Header Dialog. Click the Header button in the upper right of the Document Window to show.
Data Grid
The Data Grid is similar to a spreadsheet. The time-series data are shown in a tabular format; each variable is a column of data with a header at the top showing the name and displayed units. The left column shows the hourly date and time stamp for each row of values. The Data Grid can scroll vertically as necessary.
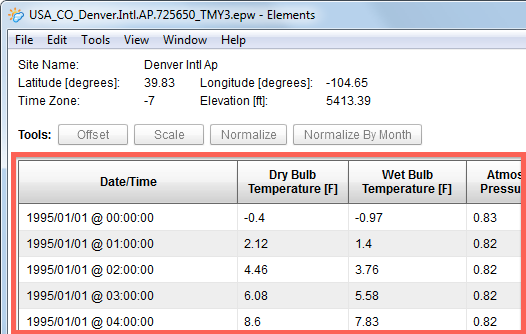
To edit an individual data value, simply double click on the cell and type in the new value.
To edit a range of data values, first make a selection by:
- Clicking on one cell, holding down Shift, and clicking on another cell to get a contiguous selection
- Clicking on one cell, holding down Ctrl (on Windows) or Command (on Mac), and clicking on various other cells to get a discontiguous selection
- Clicking on a column header to select all values in the column.
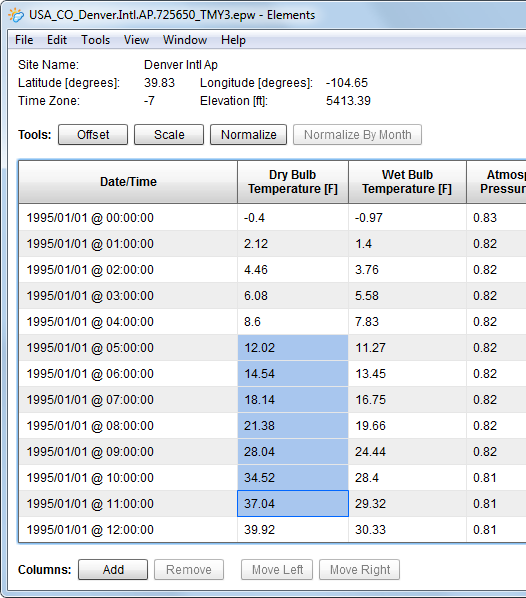
With a range of data values selected, you can apply the available Tools to edit the selection in bulk.
Edit/Copy and Edit/Paste can also be used to edit data. You can copy and paste within the same weather file, between different weather files, and to/from an external spreadsheet program such as Excel.
Edit/Undo and Edit/Redo can be used as necessary if you make a mistake.
Variables to Hold Constant
Unlike a normal spreadsheet, the Data Grid understands the relationships between certain variables. For example, the psychrometric variables (dry-bulb temperature, wet-bulb temperature, dew-point temperature, relative humidity, atmospheric pressure, density, enthalpy, and others) all share a relationship with each other through the physics of psychrometry. Similarly, the solar variables (global solar, direct solar, and diffuse solar) also share a relationship through solar angles.
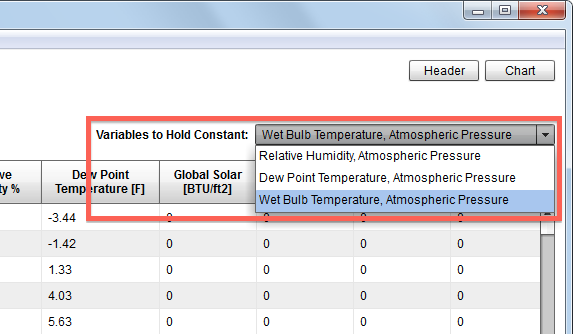
When editing data in the Data Grid, Elements ensures that related variables maintain consistency with each other. Consequently, if you change the value of one variable, the Data Grid might have to change the values of other variables. For instance, if you change dry-bulb temperature, the Data Grid may also have to change wet-bulb temperature and dew-point temperature to preserve psychometric consistency in order to hold the atmospheric pressure and relative humidity constant. Or the Data Grid could hold dew-point temperature and atmospheric pressure constant and change wet-bulb temperature and relative humidity.
The upper right of the Document Window shows a drop-down list labeled Variables to Hold Constant that allows you to select which variables are constant and which variables can change when editing data. The contents of the list change depending on which variable is selected for editing.
Columns
The lower left of the Document Window shows a set of buttons for controlling which variables are displayed as columns in the Data Grid.
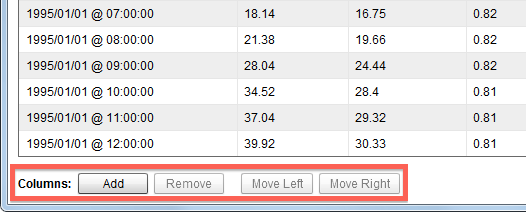
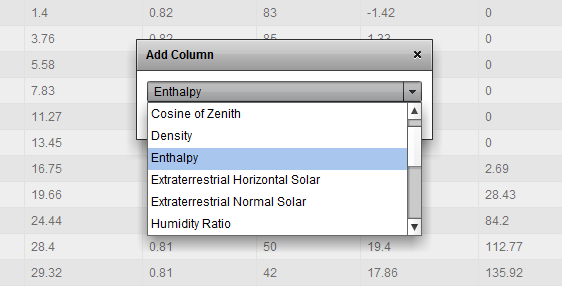
The Add button adds another variable to the view. Clicking the button displays the Add Column Dialog.
The Remove button removes the selected column from the view. The Move Left and Move Right buttons move the selected column left or right respectively. An entire column must be selected by clicking on the column header before the buttons will be enabled.
Clicking Add or Remove does not change any data in the weather file; it only changes which variables are displayed in the current view.
Tools
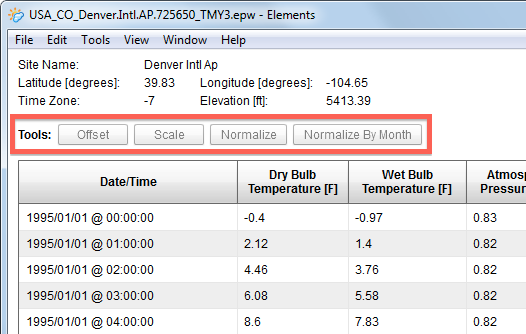
The upper left of the Document Window shows a set of buttons for tools that edit the data selection in bulk.
The following tools are available:
Offset: displaces the selected data by adding the user-specified offset to each valueScale: displaces the selected data by multiplying by the user-specified scale factorNormalize: adjusts the selected data such that their average equals the specified average. For temperatures, the tool automatically converts to absolute temperature scale first prior to performing normalization. For solar values, the integral of the selected samples is used for scaling.Normalize By Month: displays the Normalize By Month Dialog to perform normalization functions on a per-month basis.
All of the data selection must be within the same column before any of the tools buttons will be enabled.
An entire column must be selected by clicking on the column header before the Normalize By Month button will be enabled.
Units
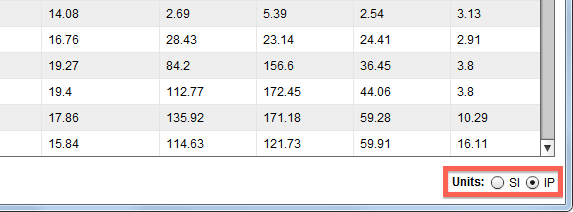
The lower right of the Document Window shows a group of radio buttons to allow you to select the unit system that is displayed. At any time you can conveniently switch between two unit systems: the international system of units (SI) or the inch-pound system of units (IP).
