Air System Fans[LINK]
Three input objects (Fan:ConstantVolume, Fan:VariableVolume,
and Fan:OnOff) provide models for fans – the prime movers in
most of the air loop and zonal air conditioning systems in
EnergyPlus. For these input objects, EnergyPlus uses a simple
polynomial-based curve-fit model to describe the relation
between the volumetric flow rate and the fan electric power,
with no explicit modeling of fan pressure rise. Consequently,
duct-static-pressure reset strategies cannot be modeled using
this approach. For CAV and VAV central air-handling systems, a
fourth input object (Fan:ComponentModel) provides a simple
physics-based model for flow-dependent fan pressure rise and
detailed models for fan, belt, motor, and
variable-frequency-drive efficiencies and energy use. This
latter input object provides the capability to analyze the
effects of duct-static-pressure reset strategies, as well as
changes in fan system element performance. All of these fan
models calculate the fan energy usage, which is often a large
fraction of HVAC energy use and a significant portion of the
building energy consumption. They also calculate the
temperature rise in the air stream caused by the static
pressure increase as the air goes through the fan. If the
motor and belt are in the air stream, waste heat from the
motor and belt also acts to raise the air stream
temperature.
Each of the four fan models is a forward type: the model
inputs describe the fan characteristics and the conditions of
the air at the fan inlet; the outputs are the fan electrical
power consumption and the conditions of the air at the fan
outlet. The model algorithms and data are contained in the
Fans module in EnergyPlus.
For the Fan:ConstantVolume,
Fan:VariableVolume,
and Fan:OnOff
models, the user describes the fan by entering values for the
design pressure rise across the fan, the design volumetric
flow rate, the fan total efficiency, and the fan motor
efficiency. The user also needs to specify the fraction of the
fan waste heat that will enter the air stream (usually 0 or
1). For the Fan:VariableVolume
model, the user must also enter the coefficients of a
4th order polynomial that relates the fan mass flow
rate to the fan power consumption. The independent variable is
the volumetric flow fraction; the dependent variable is the
fan power part load ratio. For multi-speed fans, the user must
enter a fan power ratio as a function of speed ratio
performance curve name. Multi-speed fans can only be simulated
in a parent object which allows multiple fan speeds (e.g., AirLoopHVAC:Unitary:Furnace:HeatCool,
ZoneHVAC:PackagedTerminalAirConditioner,
etc.). An optional efficiency curve may also be used when
simulating multi-speed fans to adjust the fan total efficiency
as the fan speed changes.
For the Fan:ComponentModel
object, the user describes the fan in more detail, and also
describes the duct system characteristics as seen by the fan.
In particular, the user specifies a pressure rise curve with
four coefficients that relates the fan total pressure rise to
the volumetric flow through the fan, the duct-static-pressure
set-point, and the static pressure of the spaces surrounding
the ducts. If duct-static-pressure reset is used, the user
enters a linear curve with two coefficients that relates the
pressure set-point to the volumetric flow through the fan. For
the fan itself, the user specifies the fan geometry (wheel
diameter and outlet area), maximum efficiency, the Euler
number corresponding to the maximum efficiency, the maximum
dimensionless flow, the names of four curves with several
coefficients that describe the variation of fan efficiency and
dimensionless flow with the Euler number in the normal and
stall operation regions of the fan, and a sizing factor
(applied to the maximum flow through the fan). For the belt,
the user specifies the maximum efficiency (or a curve with
five coefficients that defines the maximum efficiency as a
function of maximum fan shaft input power), three curves with
three coefficients each that relate the belt part-load
efficiency to belt fractional output torque, the motor/fan
pulley diameter ratio, the belt output torque capacity, and a
sizing factor (applied to the maximum output torque of the
belt). For the motor, the user specifies the maximum
efficiency (or a curve with three coefficients that define the
maximum efficiency as a function of maximum belt input power),
a curve with three coefficients that relate the motor
part-load efficiency to motor fractional output power, and a
sizing factor (applied to the maximum output power of the
motor). For the variable-frequency-drive (VFD), the user
specifies a curve with three coefficients that relate the VFD
part-load efficiency to motor fractional input power or to
motor fractional speed, and a sizing factor (applied to the
maximum output power of the VFD).
The models must decide whether the fan is on or off. The
primary on/off trigger is the fan schedule. This is an on/off
schedule associated with each fan: a value of 1 indicates the
fan is on; a value of 0 indicates the fan is off. The fan
schedule can be overruled by flags set by system availability
managers. If the flag TurnFansOn is true, a zero fan
schedule value will be overridden and the fan will be turned
on. If the flag TurnFansOff is true the fan will be
forced off. The inlet air mass flow rate must be greater than
zero for the fan to be on.
Generally the fan is a passive component: it accepts the
mass flow on its inlet node, uses it in its calculations of
energy consumption and temperature rise, and passes it to the
outlet node. However the fan maximum and minimum airflow rates
act as absolute limits on the airflow rate.
For multi-speed fans, the parent object determines the fan
speed ratio (i.e., the selected speed of the fan motor) and
uses this value in conjunction with the fan power ratio
performance curve to calculate the full load fan power. This
full load fan power is then used to determine the part-load
performance of the fan and motor assembly.
Simple (Single Speed) Fan Model
The following equations define the model for this fan:
On/Off Fan Model
The on/off fan model is similar to the simple fan model
with the exception that the on/off fan may cycle on and off
during a simulation time step. The cycling rate of the fan is
known as the run time fraction. The calculation of run time
fraction accounts for the part-load losses of other equipment
used in the HVAC system. A part-load factor (a.k.a. part-load
ratio) is first calculated for the fan as the ratio of the
actual operating mass flow rate to the maximum fan mass flow
rate. The run time fraction is then calculated as the
part-load factor divided by the part-load fraction. The
part-load fraction is determined by other HVAC equipment in
the simulation (Ref. DX coil) for use by this specific fan
model.
The total fan power is then calculated as the maximum fan
power multipled by the run time fraction.
The remaining calculations are the same as those described
in the simple single-speed fan mode.
Multi-Speed Fan Model
The model used to simulate a multi-speed fan relies on the
general fan laws to correct for speed changes in the fan’s
motor and the corresponding change in fan power and fan total
efficiency. Two performance curves are used to define the
change in power and efficiency as shown below. The power ratio
curve must be used to simulate a multi-speed fan. The power
ratio curve modifies the fan power based on a change in fan
speed according to the cubic fan law. Exponents other than 3
are allowed. The efficiency ratio curve is used to correct for
changes in nominal efficiency at alternate fan speeds. If
either or both of these curves are not provided, the ratio is
assumed to be 1.
The power ratio term is evaluated using an exponent
performance curve. The form of the exponent curve equation is
shown below.
The exponent performance curve is used to evaluate the
power ratio as a function of speed ratio (x in the equation
above). For typical fan performance, coefficient C1 = 0 and
coefficient C2 = 1. The exponent (C3) is typically equal to 3
(cubed fan law) but other values are allowed.
The efficiency ratio curve is a quadratic or cubic curve
used to evaluate the efficiency ratio as a function of speed
ratio (x in the following equation). The cubic equation form
is shown below.
The curve coefficients are determine by correlating the
normalized fan total efficiency (i.e., the actual fan total
efficiency divided by the nominal fan total efficiency at a
speed ratio of 1) to the speed ratio (i.e., the ratio of
actual air flow rate through the fan to the maximum fan air
flow rate).
To account for the change in fan speed and to ensure that
the run time fraction is accurately calculated, an adjustment
to the previous calculation for run time fraction is made.
This adjusts the calculated run time fraction to account for
times when the fan speed has been reduced and the new speed is
now considered the fan’s maximum speed. The speed adjusted run
time fraction is then used in the fan power calculation.
Each of the performance curves described above may be used
to model the performance of a multi-speed fan motor, however,
the power ratio curve must be used to envoke the multi-speed
simulation. These curves are used when the fan is used in an
HVAC system having multiple flow rates (i.e., different flow
rates in cooling and heating mode). If an HVAC system operates
at the same speed in either cooling or heating mode, these
curves are not required. When these curves are not used, the
associated ratio term in the equation above is assumed to be
1. The remaining calculations are identical to the simple
single-speed fan model described above.
Variable Speed Fan Model
The model for the variable speed fan is similar to the
simple single-speed fan model except for a part load factor
that multiplies the fan power consumption.
The rest of the calculation is the same as for the simple
fan.
Nomenclature for
Simple Models[LINK]
 is the fan power in
watts;
is the fan power in
watts;
 is the air mass flow in
kg/s;
is the air mass flow in
kg/s;
 is the design (maximum)
air flow in kg/s;
is the design (maximum)
air flow in kg/s;
 is the fan design
pressure increase in Pascals;
is the fan design
pressure increase in Pascals;
 is the fan total
efficiency;
is the fan total
efficiency;
 is the air density at
standard conditions in kg/m3;
is the air density at
standard conditions in kg/m3;
 is the motor
efficiency;
is the motor
efficiency;
 is the fan shaft power in
watts;
is the fan shaft power in
watts;
 is the power entering the
air in watts;
is the power entering the
air in watts;
 is the ratio of actual
fan flow rate (or speed) to maximum fan flow rate (or
speed)
is the ratio of actual
fan flow rate (or speed) to maximum fan flow rate (or
speed)
 are the inlet and outlet
air stream specific enthalpies in J/kg;
are the inlet and outlet
air stream specific enthalpies in J/kg;
 are the inlet and outlet
air stream humidity ratios;
are the inlet and outlet
air stream humidity ratios;
 is the outlet air
temperature in degrees C;
is the outlet air
temperature in degrees C;
 is the EnergyPlus
psychrometric routine relating enthalpy and humidity ratio to
temperature;
is the EnergyPlus
psychrometric routine relating enthalpy and humidity ratio to
temperature;
 is the flow fraction or
part-load ratio;
is the flow fraction or
part-load ratio;
 is the part load
factor.
is the part load
factor.
Component Fan Model
The Fan:ComponentModel
object is based upon combining: modified forms of fan, belt,
motor, and variable-frequency-drive (VFD) element models
(Stein and Hydeman 2004); a simplified fan pressure rise model
with distribution system leakage, duct static pressure, and
conditioned space pressure control effects included (Sherman
and Wray 2010); and a diagnostic-based simplified duct
static-pressure reset (SPR) scheme for air-handling systems
(Federspiel 2004, 2005).
Fan electric power depends on fan air
power (product of the airflow through and pressure rise across
the fan), mechanical efficiencies (fan and belt), and
electrical efficiencies (motor and drive). For systems with
variable flows, none of these parameters is constant and all
are interrelated. For example, Figure 189 shows that fan
efficiency strongly depends on fan flow as well as
pressure rise, although this is not obvious from the
manufacturer’s power and speed performance map (top left). Fan
efficiency maps can be derived from the manufacturer’s
performance map using a commercially-available software-based
data extraction tool such as DigitizeIt and by applying the
following equation to the extracted data:
 ()
()
where ΔPfan is the fan
pressure rise (Pa); Qfan is the fan flow
at standard conditions (m3/s); and
Hfan is the fan shaft power (W). Fan speed
values also can be derived from the manufacturer’s performance
map using a similar software-based data extraction tool.
Fan pressure rise must be sufficient to overcome the
air-handling system pressure drop, which depends on duct
static pressure, on duct and equipment leakage, and on
pressure drops across duct and duct-like elements (e.g.,
dampers, fittings), coils, and filters that are connected to
the fan. Duct
and duct-like pressure drops increase approximately as the
square of the flow through them. However, pressure drops
across coils and filters behave differently: they are
proportional to the flow raised to a power n, which can
approach one for high-efficiency filters and wet coils (Liu et
al. 2003, Trane 1999).
The relation between system pressure drop and flow defines
what is commonly called a “system curve”. When system
characteristics change, such as when the duct static pressure
set point is varied, a family of system curves results. The
intersections of these curves with fan curves (e.g., power as
a function of pressure rise and flow) on a pressure versus
flow plot define one or more loci of unique fan operating
points. Each of these points has an associated fan efficiency,
power, and speed.
Fan Pressure Rise Model: To calculate fan pressure
rise based on flow through the fan, Sherman and Wray (2010)
have developed a simple physics-based data-driven four
parameter duct system model for the purpose of simulating its
system curve. The embodiment of the model for a fixed outdoor
air fraction that can be applied to constant- or
variable-volume central air-handling systems is:
 ()
()
where ΔPfan,tot is the
fan total pressure rise (Pa); Qfan is the
fan flow at standard conditions (m3/s);
Psm is the duct static pressure set point
(Pa); Po is the static pressure of the
spaces surrounding the ducts (Pa); and
Afpr, Bfpr,
Cfpr, and Dfpr are
constant coefficients that represent different aspects of the
fan pressure rise model as described below.
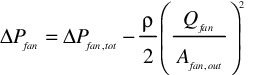
Fan static pressure rise is determined from the total
pressure rise by subtracting the outlet velocity pressure:
 ()
()
where Afan,out is the fan outlet area
(m2) and ρ is the air density at the fan
inlet (kg/m3).
The first term in Equation looks like the common system
curve in which the fan pressure rise is proportional to the
square of the fan flow, but here it also depends implicitly on
supply and return pressure losses, and in part on the fraction
of the fan flow that is outdoor air (essentially “leaks” into
and out of the return side of the system). Very often it is
the only term considered, but that would only be correct with
fixed-position dampers, no distribution system leakage, no
linear resistance components, and no duct static pressure
control.
The second term accounts for significant flow resistances
in the system where the pressure difference is linearly
proportional to the flow. Some filters and coils in the return
may need this term to be adequately described. This term could
be ignored if there are no linear components or if their
pressure drops are very small compared to the other terms.
The third term, which depends on the fan flow and square
root of the supply duct pressure Psm,
accounts in part for air leakage from the supply system when
damper positions are fixed or are changed independently of
static pressure or fan flow. In this case, reducing or
eliminating supply leakage results in a different system
curve. This, however, might be only a minor “correction” to
the simple system curves generally used. The third term is
zero when VAV box dampers are modulated to control flow.
Consequently, with variable-position supply dampers, reducing
or eliminating supply leakage does not change the system
curve.
The last term also accounts in part for leakage from the
supply system when damper positions are fixed or are changed
independently of static pressure or fan flow. This term
indicates that the same fan pressure rise can be achieved by
raising the duct pressure and closing dampers. The only change
in the system in such a case is that the leakage flow may
increase. The coefficient for this term is equal to one when
the VAV box dampers are modulated to control flow. In both
cases, this term may be the most important “correction” to the
simple system curves generally used, especially at low
flows.
In principle, especially for research applications of
Energy Plus, the four individual fan pressure rise
coefficients can be determined using duct design calculation
tools for the entire system (e.g., Right-CommDuct, UNI-DUCT,
Ductsize, Varitrane Duct
Designer, T-Duct). In practice, however, especially for
existing buildings, the necessary details may not be known
sufficiently. In that case, one can make active measurements
at different combinations of fan flows, outside air fractions,
damper positions (if they are variable), and duct static
pressures and then use non-linear system identification
techniques to fit the data and determine the coefficients. If
passive measurements can be made over a sufficiently long time
so that a wide range of outside air settings, damper
positions, and fan flows is obtained, one could instead
regress the data to find all of the parameters in the
equation. Unfortunately, there are no standardized test
procedures available to draw upon, even though some standards
appear to be related (e.g., ASHRAE 1999, 2008). Consequently,
field test protocols need to be developed to determine the
parameters for the new duct system model. These protocols then
need to be integrated into standardized data collection and
analysis tools such as Pacific Gas and Electric’s “Universal
Translator” tool. The California Energy Commission is funding
such a project; data, procedures, and tools from this project
will support the EnergyPlus implementation of the fan and duct
system models described here.
SPR Model: The model for duct-static-pressure
reset (SPR) is based on a simple diagnostic procedure and a
linear correlation between duct static pressure and supply fan
airflow (Federspiel 2004, 2005). The diagnostic method
involves measuring the static pressure at the duct static
pressure sensor and the velocity pressure at the fan inlet
(represents the fan flow) at multiple points over the fan’s
operating range, while the VAV box dampers attempt to control
flow in response to a constant thermostat setpoint. The goal
of the test is to define the lowest duct static pressure where
all VAV boxes are still in control (dampers modulating). In
the model, the correlation between Psm and
Qfan is as follows for
Qfan,min ≤ Qfan ≤
Qfan,max:
 ()
()
Where
 and
and  ()
()
For Qfan <
Qfan,min, Psm =
Psm,min; for Qfan >
Qfan,max, Psm =
Psm,max
Fan Efficiency and Shaft Input Power Model: A
dimensionless parameter in the form of an Euler number can be
used to simplify the description of fan static efficiency
variations:
 ()
()
where ΔPfan is the fan
static pressure rise (Pa), Dfan is the fan
wheel outer diameter (m), ρ is the air density at the
fan inlet (kg/m3), and Qfan is
the fan flow at standard conditions (m3/s).
Eu is nominally the ratio of pressure forces across
the fan to inertial forces at the fan wheel exit.
By plotting the normalized fan static efficiency
(static efficiency / maximum static efficiency)
versus the logarithm base 10 of the normalized Euler number
(Eu / Eu at maximum static efficiency), the
dimensionless performance of various fan sizes is very similar
(as one might expect from the “fan laws”), but so also is the
dimensionless performance of different types of fans
(e.g., single-inlet plenum fans, double-inlet housed
centrifugal fans, mixed flow fans, vane axial fans, fans with
backward or forward curved blades). An example of this
correlation for the “normal operation” (non-stall) and stall
regions of eight fans is shown in Figure 190.
This model uses a continuous function to represent the
normalized fan efficiency (ηfan)
variation. The normalized exponential-conditioned skew-normal
functional relationship is:
 ()
()
where
xfan = log10(Eu /
Eumax)
Z1 = (xfan - afan) /
bfan; Z2 =
((e(cfan*xfan)*dfan*xfan)
- afan) / bfan; Z3 =
-afan / bfan
For conceptual design when only rough estimates are needed,
a generic curve (also shown in Figure 190) can be used and
then one only needs to know the maximum efficiency
(ηfan,max) and Eu at that maximum
(Eumax) to entirely model the fan
efficiency and hence fan power. The dimensionless coefficients
for the generic normalized fan efficiency curve are as
follows:
afan = -2.732094,
bfan = 2.273014, cfan
= 0.196344, dfan = 5.267518
In this case, the coefficient of determination
R2 is 0.994. Also, the average and RMS differences
between the efficiency values based on extracted data and the
fitted generic curve are, respectively, about 0.5% and 1.4%;
maximum differences are about ±9%.
If more accuracy is needed for a specific fan, a similarly
shaped curve can be developed for that fan (using extracted
data, Equation , and least-squares regression techniques),
segmented into normal operation and stall regions with
specific coefficients fitted for each region. Figure 191 shows
an example, using the data from Figure 189.
For this specific fan, the coefficients are:
Normalized Fan Efficiency Coefficients for Specific
Backward-Curved Plenum Fan
| Operating Region |
afan |
bfan |
cfan |
dfan |
| Normal (Non-Stall) |
0.072613 |
0.833213 |
0 |
0.013911 |
| Stall |
-2.354091 |
2.117493 |
0 |
2.753264 |
In this case, the average and RMS differences between the
efficiency values based on extracted data and fitted specific
curve (R2 is 0.999) are, respectively, about -0.1%
and 0.3%; maximum differences are about ±0.7%. Field tests are
especially needed to determine the coefficients for installed
fans because fans are susceptible to “system effects” (e.g.,
inlet obstructions) that are not included in the manufacturer
test data (AMCA 1990a).
To determine fan efficiency and fan shaft power at a
particular time step, first calculate the fan pressure rise
(ΔPfan) using the time
step fan flow (Qfan) and Equation (and
also using Equations and if there is SPR). Next, calculate
Eu using Equation and then xfan
(log10 normalized Eu), which is based on
Eu and the specified Eumax
(Eu at maximum efficiency) for the fan. The
corresponding normalized efficiency
(ηfan(xfan) /
ηfan,max) is obtained using Equation . The fan
efficiency
(ηfan(xfan)) therefore
is:
 ()
()
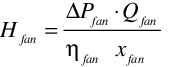
The fan shaft input power (mechanical, W) is:
 ()
()
Fan Shaft Speed and Torque Modeling: For rotating
elements, power (H) is the product of torque
(τ) and rotational speed (ω), or conversely, torque
is power divided by rotational speed (τ = H / ω).
The Stein and Hydeman variable-frequency-drive (VFD)
component model correlates VFD efficiency as a linear function
of VFD fractional output power (i.e., motor input power).
Available data for about 50 drives from Saftronics were
apparently used to develop their model, but those data
represent VFD efficiency as a function of motor fractional
speed(ωmotor / ωmotor,max, or
nominally, drive output frequency divided by maximum output
frequency, if motor slip is ignored).
To make use of the available data, the Stein and Hydeman
linear correlation must intrinsically make an assumption that
motor speed and torque have some fixed relationship. Although
not documented, their assumption might be the common belief
that fractional torque (τ / τmax) for a motor is
simply the square of its fractional speed. For fans serving
duct systems with components such as filters and coils, with
relatively low pressure drops elsewhere in the system, and for
systems that have a non-zero controlled duct static pressure,
this assumption may be inappropriate. Consequently, to make
use of the available data and to avoid such assumptions, one
needs to know the fraction of full speed at which fan
components operate.
For the fan, dimensionless flow (φ) can be defined
as (ASHRAE 1993):
 ()
()
where ωfan is the fan speed (rad/s).
This parameter can be calculated for each operating point on
the fan manufacturer’s performance map that represents fan
speed as a function of flow and fan pressure rise. To simplify
the data representation to a single curve (as we have done for
fan efficiency), one can plot normalized dimensionless flow
(dimensionless flow divided by maximum dimensionless flow,
(φ(xfan) /
φmax) as a function of the log base 10 of
the normalized Euler (Eu) parameter
(xfan). Figure 192 shows an example plot
derived from the manufacturer’s data in Figure 189.
Equation describes the sigmoidal functional form for
normalized φ:
 ()
()
where Aspd, Bspd,
Cspd, Dspd, and
Espd are coefficients for the fan.
Separate sets of coefficients for the normal operation and
stall regions can be specified. For the curve shown in Figure
192, these coefficients are:
Dimensionless Flow Coefficients – Specific
Backward-Curved Fan
| Operating Region |
Aspd |
Bspd |
Cspd |
Dspd |
Espd |
| Normal (Non-Stall) |
0 |
1.001423 |
0.123935 |
-0.476026 |
1 |
| Stall |
0 |
5.924993 |
-1.916316 |
-0.851779 |
1 |
For a generic centrifugal fan with backward-curved blades,
the coefficients are:
Dimensionless Flow Coefficients – Generic
Backward-Curved Fan
| Operating Region |
Aspd |
Bspd |
Cspd |
Dspd |
Espd |
| Normal (Non-Stall) |
-0.551396 |
1.551467 |
-0.442200 |
-0.414006 |
0.234867 |
| Stall |
0.000608 |
0.586366 |
0.021775 |
-0.063218 |
0.072827 |
For any operating point of flow (Qfan)
and fan pressure rise
(ΔPfan), one can
calculate the corresponding Euler number (Eu) for the
given fan, and then determine the corresponding normalized
dimensionless flow (φ(xfan)
/ φmax) from the sigmoidal
dimensionless flow function (Equation ). With
φ(xfan) /
φmax determined and knowing
φmax for the fan, the dimensionless flow
is:
 ()
()
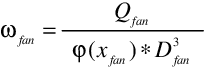
With φ(xfan) determined, the
fan rotational speed (rad/s) is:
 ()
()
Fan shaft torque (N∙m), which the belt drive must supply to
the fan shaft, is then:
 ()
()
The fraction of full-load driven torque for the belt
(τfan / τbelt,max), which is
typically called “belt load”, is thus τfan
divided by the belt torque capacity
(τbelt,max). For a particular belt type
and cross-section, belt torque capacity can be determined from
manufacturer’s information such as a shaft speed versus power
chart.
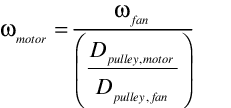
Ignoring belt slip, motor shaft speed
(ωmotor, rad/s) can then be determined
using the fan speed (ωfan) and the
motor/fan pulley diameter ratio (Dpulley,motor
/ Dpulley,fan), which is typically called the
“drive” ratio:
 ()
()
Belt, Motor, and Variable-Frequency-Drive Efficiency
and Input Power Models – Overview: The models for belt
drives, motors, and VFDs that Stein and Hydeman included in
their air-handling system model represent maximum efficiency
as a function of power input to the adjacent downstream
component (e.g., the power input to a fan shaft by a belt
drive), but they do not include part-load models. The
part-load models are needed, because part-load efficiency for
these components can fall off rapidly at low load (e.g., to
zero at zero load) and many systems operate occasionally (and
some much of the time) at low loads, in part because of
current practices that result in substantial oversizing of
components.
Belt Efficiency and Input Power Model: Figure 193
shows three maximum efficiency (ηbelt,max)
curves for belts (low, medium, and high) as a function of
maximum fan shaft torque. This set of efficiency curves is
based on belt drive loss data from AMCA Publication 203
(1990b), which reportedly is an aggregation of data from over
400 tests.
To determine ηbelt,max if data for a
specific belt are not available, first use the maximum fan
shaft input power (Hfan,max) for the load
spectrum to calculate the natural logarithm of belt power
capacity:
xbelt,max =
ln(Hfan,max) with
Hfan,max expressed in terms of hp()
Then, use Equations and , along with a choice of low,
medium, or high efficiency coefficients from Table 60, to
calculate ηbelt,max.
The quartic polynomial curves in Figure 193 and their
coefficients are as follows:
 ()
()
Belt Maximum Efficiency Curve Coefficients
| Efficiency Class (Loss) |
c1 |
c2 |
c3 |
c4 |
c5 |
| High (Low Loss) |
-6.502E-2 |
2.475E-2 |
-6.841E-3 |
9.383E-4 |
-5.168E-5 |
| Medium (Medium Loss) |
-9.504E-2 |
3.415E-2 |
-8.897E-3 |
1.159E-3 |
-6.132E-5 |
| Low (High Loss) |
-1.422E-1 |
5.112E-2 |
-1.353E-2 |
1.814E-3 |
-9.909E-5 |
The belt maximum efficiency is therefore:
 ()
()
The normalized part-load belt efficiency model is
provided to modify the maximum efficiency of the belt. This
model is based on part-load data for belts in ACEEE’s handbook
on motor systems (Nadel et al. 2002). To determine the
normalized belt efficiency at part-load
(ηbelt(xbelt) **/
ηbelt,max), use the fan shaft (belt
output) fractional torque (xbelt =
τbelt /
τbelt,max;τbelt =
τfan) as the belt fractional load in Equation
or (select the equation for the region that contains
xbelt) and use coefficients from Table 61
that correspond to that region and the belt type: V-Belt or
synchronous (toothed). Figure 194 shows a graphical
representation of the curves defined by these equations and
coefficients.
The belt normalized (part-load) efficiency curves in Figure
194 for Regions 1 and 3 (single rectangular hyperbola type 2)
and Region 2 (exponential decay), respectively, and their
coefficients are as follows:
Region 1 (0 <= xbelt <
xbelt,trans) and Region 3
(xbelt > 1):
 ()
()
Region 2 (xbelt,trans <=
xbelt <= 1):
 ()
()
where xbelt =  belt /
  belt,max
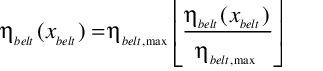
Belt efficiency therefore is:
 ()
()
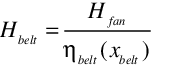
Belt input power (mechanical, W) at the motor shaft is:
 ()
()
Belt Normalized Efficiency Curve Coefficients
Belt Type
xbelt,trans
Region
abelt
bbelt
cbelt
V-Belt
0.167
1
0.920797
0.026269
0.151594
2
1.011965
-0.339038
-3.436260
3
1.037778
0.010307
-0.026815
Synchronous
0.137
1
0.982167
0.049135
0.158164
2
1.002134
-0.531885
-5.295707
3
1
0
0
Motor Efficiency and Input Power Model: Figure 195
shows three maximum efficiency
(ηmotor,max) curves for motors (low,
medium, and high) as a function of rated motor output power
(belt input power). This set of efficiency curves is based on
maximum efficiency data in DOE’s MotorMaster+ database (2003)
from about 800 tests. It is provided for use in the absence of
manufacturer’s data.
To determine ηmotor,max if data for a
specific motor are not available (e.g., as listed in Table
63), first use the maximum belt input power
(Hbelt,max) for the load spectrum
(multiplied by whatever oversizing factor may be desired) to
calculate the natural logarithm of belt power capacity:
xmotor,max =
ln(Hbelt,max) with
Hbelt,max expressed in terms of hp()
Then, use Equation , along with a choice of low, medium, or
high efficiency coefficients from Table 62, to calculate
ηmotor,max.
The maximum motor efficiency curves in Figure 195 (single
rectangular hyperbola type 1) and their coefficients are as
follows:
 ()
()
Motor Maximum Efficiency Curve Coefficients
| Case |
amotor,max |
bmotor,max |
cmotor,max |
| High-Efficiency |
0.196205 |
3.653654 |
0.839926 |
| Mid-Efficiency |
0.292280 |
3.368739 |
0.762471 |
| Low-Efficiency |
0.395895 |
3.065240 |
0.674321 |
The normalized part-load motor efficiency model is
provided to modify the maximum efficiency of the motor. This
model is based on part-load data for motors from DOE’s
MotorMaster+ database (2003). To determine the normalized
motor efficiency at part-load
(ηmotor(xmotor) **/
ηmotor,max), use the motor fractional
power output (xmotor = Hbelt /
Hbelt,max) as the fraction of motor output
power in Equation and use coefficients from Table 63, or for a
specific motor, determined from DOE MotorMaster+ data or from
manufacturer’s data. Figure 196 shows a graphical
representation of eight example curves defined by these
equations and coefficients.
The example motor normalized efficiency curves (single
rectangular hyperbola type 2) and their coefficients as a
function of motor load fraction in Figure 196 are determined
from DOE MotorMaster+ data and are as follows:
 ()
()
Example Motor Normalized Efficiency Curve Coefficients
Poles
Motor RatedOutput (hp)
MaximumEfficiency
aPLmotor
bPLmotor
cPLmotor
8
1
0.6675
1.096694
0.097126
0.002011
4
1
0.7787
1.092165
0.082060
-0.007200
5
0.8400
1.223684
0.084670
-0.135186
10
0.8745
1.146258
0.045766
-0.110367
25
0.8991
1.137209
0.050236
-0.089150
50
0.9129
1.088803
0.029753
-0.064058
75
0.9259
1.077140
0.029005
-0.049350
100
0.9499
1.035294
0.012948
-0.024708
125
0.9527
1.030968
0.010696
-0.023514
Motor efficiency therefore is:
 ()
()
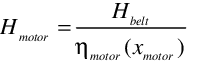
Motor input power (electrical, W) is:
 ()
()
VFD Efficiency and Input Power Model: For VFDs,
published performance data are limited. Data from DOE (2008)
suggest using a functional relation similar to that used for
motors to represent VFD efficiency (ηVFD)
as a function of the fraction of full-load motor input power
(xVFD = Hmotor /
Hmotor,max), as shown in Figure 197, or as
a function of the fraction of full-load speed
(xVFD = ωmotor /
ωmotor,max), as shown in Figure 198.
The performance curve (single rectangular hyperbola type 2)
used here for VFD efficiency is:
 ()
()
Example coefficients derived from the DOE data as a
function of the fraction of full-load motor input power are
listed in Table 64.
Example VFD Efficiency Curve Coefficients
| VFD RatedOutput Power (hp) |
avfd |
bvfd |
cvfd |
| 3 |
0.978856 |
0.034247 |
-0.007862 |
| 5 |
0.977485 |
0.028413 |
-0.002733 |
| 10 |
0.978715 |
0.022227 |
0.001941 |
| 20 |
0.984973 |
0.017545 |
-0.000475 |
| 30 |
0.987405 |
0.015536 |
-0.005937 |
| 50 |
0.987910 |
0.018376 |
-0.001692 |
| 60 |
0.971904 |
0.014537 |
0.011849 |
| 75 |
0.991874 |
0.017897 |
-0.001301 |
| 100 |
0.982384 |
0.012598 |
0.001405 |
| >= 200 |
0.984476 |
0.009828 |
-0.004560 |
VFD input power (electrical, W) is:
 ()
()
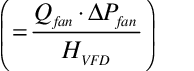
System Total Efficiency: The combined efficiency
of the fan system components (i.e., fan, belt, motor, and VFD)
is:

 ()
()
Heat Loss to Air: To calculate the temperature
rise from waste heat entering the air stream from the fan,
belt, and motor, it is assumed that the user-specified “motor
in air fraction” applies to the belt and motor but not to the
VFD. The power “lost” to the air (W) is:
 ()
()
AMCA. 1990a. “Fans and Systems”. Publication 201-90.
Arlington Heights, IL: Air Movement and Control Association
International.
AMCA. 1990b. “Field Performance Measurement of Fan
Systems”. Publication 203-90. Arlington Heights, IL: Air
Movement and Control Association International.
ASHRAE. 1993. HVAC 2 Toolkit: Algorithms and Subroutines
for Secondary HVAC System Energy Calculations. Atlanta:
American Society of Heating, Refrigerating and
Air-Conditioning Engineers, Inc.
ASHRAE. 1999. “ANSI/ASHRAE Standard 120 Method of Testing
to Determine Flow Resistance of HVAC Ducts and Fittings”.
Atlanta: American Society of Heating, Refrigerating and
Air-Conditioning Engineers, Inc.
ASHRAE. 2008. “ANSI/ASHRAE Standard 126 Method of Testing
HVAC Air Ducts and Fittings”. Atlanta: American Society of
Heating, Refrigerating and Air-Conditioning Engineers,
Inc.
DOE. 2003. “MotorMaster 4.0 User Guide”. U.S. Department of
Energy, Industrial Technologies Program.
http://www1.eere.energy.gov/industry/bestpractices/software_motormaster.html
DOE. 2008. “Energy Tips – Motor: Motor Tip Sheet #11”. U.S.
Department of Energy, Industrial Technologies Program.
June.
http://www1.eere.energy.gov/industry/bestpractices/pdfs/motor_tip_sheet11.pdf
Federspiel, C. 2004. “Detecting Optimal Fan Pressure”.
Final Report of Federspiel Controls to the CEC Energy
Innovations Small Grant Program. Grant #: 02-03.
Federspiel, C. 2005. “Detecting Critical Supply Duct
Pressure”. ASHRAE Transactions, Vol. 111, Part 1. Atlanta:
American Society of Heating, Refrigerating and
Air-Conditioning Engineers, Inc.
Heredos, Francis P. 1987. Selection and Application of
Multispeed Motors, IEEE Transactions on Industry Applications,
Vol. 1A-23, No. 2, March/April.
Liu, M., D.E. Claridge, and S. Deng. 2003. “An Air Filter
Pressure Loss Model for Fan Energy Calculation in Air-Handling
Units”. International Journal of Energy Research. Vol. 27,
pp. 589-600.
Nadel, S., R.N. Elliot, M. Shepard, S. Greenberg, G. Katz,
and A.T. de Almeida. 2002. “Energy-Efficient Motor Systems: A
Handbook on Technology, Program, and Policy Opportunities” 2nd
Edition. Washington, DC: American Council for an Energy
Efficient Economy. p.188.
Sherman, M.H. and C.P. Wray. 2010. “Parametric System
Curves: Correlations Between Fan Pressure Rise and Flow for
Large Commercial Buildings”. Lawrence Berkeley National
Laboratory Report, LBNL-3542E.
Stein, J. and M.M. Hydeman. 2004. “Development and Testing
of the Characteristic Curve Fan Model”. ASHRAE Transactions,
Vol. 110, Part 1. Atlanta: American Society of Heating,
Refrigerating and Air-Conditioning Engineers, Inc.
Trane. 1999. “Delta-Flo Coils: Data Catalog
PL-AH-COIL-000-D-2-799”. LaCrosse, WI: The Trane Company.
July.

Air System Fans[LINK]
Overview[LINK]
Three input objects (Fan:ConstantVolume, Fan:VariableVolume, and Fan:OnOff) provide models for fans – the prime movers in most of the air loop and zonal air conditioning systems in EnergyPlus. For these input objects, EnergyPlus uses a simple polynomial-based curve-fit model to describe the relation between the volumetric flow rate and the fan electric power, with no explicit modeling of fan pressure rise. Consequently, duct-static-pressure reset strategies cannot be modeled using this approach. For CAV and VAV central air-handling systems, a fourth input object (Fan:ComponentModel) provides a simple physics-based model for flow-dependent fan pressure rise and detailed models for fan, belt, motor, and variable-frequency-drive efficiencies and energy use. This latter input object provides the capability to analyze the effects of duct-static-pressure reset strategies, as well as changes in fan system element performance. All of these fan models calculate the fan energy usage, which is often a large fraction of HVAC energy use and a significant portion of the building energy consumption. They also calculate the temperature rise in the air stream caused by the static pressure increase as the air goes through the fan. If the motor and belt are in the air stream, waste heat from the motor and belt also acts to raise the air stream temperature.
Model[LINK]
Each of the four fan models is a forward type: the model inputs describe the fan characteristics and the conditions of the air at the fan inlet; the outputs are the fan electrical power consumption and the conditions of the air at the fan outlet. The model algorithms and data are contained in the Fans module in EnergyPlus.
Inputs and Data[LINK]
For the Fan:ConstantVolume, Fan:VariableVolume, and Fan:OnOff models, the user describes the fan by entering values for the design pressure rise across the fan, the design volumetric flow rate, the fan total efficiency, and the fan motor efficiency. The user also needs to specify the fraction of the fan waste heat that will enter the air stream (usually 0 or 1). For the Fan:VariableVolume model, the user must also enter the coefficients of a 4th order polynomial that relates the fan mass flow rate to the fan power consumption. The independent variable is the volumetric flow fraction; the dependent variable is the fan power part load ratio. For multi-speed fans, the user must enter a fan power ratio as a function of speed ratio performance curve name. Multi-speed fans can only be simulated in a parent object which allows multiple fan speeds (e.g., AirLoopHVAC:Unitary:Furnace:HeatCool, ZoneHVAC:PackagedTerminalAirConditioner, etc.). An optional efficiency curve may also be used when simulating multi-speed fans to adjust the fan total efficiency as the fan speed changes.
For the Fan:ComponentModel object, the user describes the fan in more detail, and also describes the duct system characteristics as seen by the fan. In particular, the user specifies a pressure rise curve with four coefficients that relates the fan total pressure rise to the volumetric flow through the fan, the duct-static-pressure set-point, and the static pressure of the spaces surrounding the ducts. If duct-static-pressure reset is used, the user enters a linear curve with two coefficients that relates the pressure set-point to the volumetric flow through the fan. For the fan itself, the user specifies the fan geometry (wheel diameter and outlet area), maximum efficiency, the Euler number corresponding to the maximum efficiency, the maximum dimensionless flow, the names of four curves with several coefficients that describe the variation of fan efficiency and dimensionless flow with the Euler number in the normal and stall operation regions of the fan, and a sizing factor (applied to the maximum flow through the fan). For the belt, the user specifies the maximum efficiency (or a curve with five coefficients that defines the maximum efficiency as a function of maximum fan shaft input power), three curves with three coefficients each that relate the belt part-load efficiency to belt fractional output torque, the motor/fan pulley diameter ratio, the belt output torque capacity, and a sizing factor (applied to the maximum output torque of the belt). For the motor, the user specifies the maximum efficiency (or a curve with three coefficients that define the maximum efficiency as a function of maximum belt input power), a curve with three coefficients that relate the motor part-load efficiency to motor fractional output power, and a sizing factor (applied to the maximum output power of the motor). For the variable-frequency-drive (VFD), the user specifies a curve with three coefficients that relate the VFD part-load efficiency to motor fractional input power or to motor fractional speed, and a sizing factor (applied to the maximum output power of the VFD).
Control[LINK]
The models must decide whether the fan is on or off. The primary on/off trigger is the fan schedule. This is an on/off schedule associated with each fan: a value of 1 indicates the fan is on; a value of 0 indicates the fan is off. The fan schedule can be overruled by flags set by system availability managers. If the flag TurnFansOn is true, a zero fan schedule value will be overridden and the fan will be turned on. If the flag TurnFansOff is true the fan will be forced off. The inlet air mass flow rate must be greater than zero for the fan to be on.
Generally the fan is a passive component: it accepts the mass flow on its inlet node, uses it in its calculations of energy consumption and temperature rise, and passes it to the outlet node. However the fan maximum and minimum airflow rates act as absolute limits on the airflow rate.
For multi-speed fans, the parent object determines the fan speed ratio (i.e., the selected speed of the fan motor) and uses this value in conjunction with the fan power ratio performance curve to calculate the full load fan power. This full load fan power is then used to determine the part-load performance of the fan and motor assembly.
Simulation[LINK]
Simple (Single Speed) Fan Model
The following equations define the model for this fan:
On/Off Fan Model
The on/off fan model is similar to the simple fan model with the exception that the on/off fan may cycle on and off during a simulation time step. The cycling rate of the fan is known as the run time fraction. The calculation of run time fraction accounts for the part-load losses of other equipment used in the HVAC system. A part-load factor (a.k.a. part-load ratio) is first calculated for the fan as the ratio of the actual operating mass flow rate to the maximum fan mass flow rate. The run time fraction is then calculated as the part-load factor divided by the part-load fraction. The part-load fraction is determined by other HVAC equipment in the simulation (Ref. DX coil) for use by this specific fan model.
The total fan power is then calculated as the maximum fan power multipled by the run time fraction.
The remaining calculations are the same as those described in the simple single-speed fan mode.
Multi-Speed Fan Model
The model used to simulate a multi-speed fan relies on the general fan laws to correct for speed changes in the fan’s motor and the corresponding change in fan power and fan total efficiency. Two performance curves are used to define the change in power and efficiency as shown below. The power ratio curve must be used to simulate a multi-speed fan. The power ratio curve modifies the fan power based on a change in fan speed according to the cubic fan law. Exponents other than 3 are allowed. The efficiency ratio curve is used to correct for changes in nominal efficiency at alternate fan speeds. If either or both of these curves are not provided, the ratio is assumed to be 1.
The power ratio term is evaluated using an exponent performance curve. The form of the exponent curve equation is shown below.
The exponent performance curve is used to evaluate the power ratio as a function of speed ratio (x in the equation above). For typical fan performance, coefficient C1 = 0 and coefficient C2 = 1. The exponent (C3) is typically equal to 3 (cubed fan law) but other values are allowed.
The efficiency ratio curve is a quadratic or cubic curve used to evaluate the efficiency ratio as a function of speed ratio (x in the following equation). The cubic equation form is shown below.
The curve coefficients are determine by correlating the normalized fan total efficiency (i.e., the actual fan total efficiency divided by the nominal fan total efficiency at a speed ratio of 1) to the speed ratio (i.e., the ratio of actual air flow rate through the fan to the maximum fan air flow rate).
To account for the change in fan speed and to ensure that the run time fraction is accurately calculated, an adjustment to the previous calculation for run time fraction is made. This adjusts the calculated run time fraction to account for times when the fan speed has been reduced and the new speed is now considered the fan’s maximum speed. The speed adjusted run time fraction is then used in the fan power calculation.
Each of the performance curves described above may be used to model the performance of a multi-speed fan motor, however, the power ratio curve must be used to envoke the multi-speed simulation. These curves are used when the fan is used in an HVAC system having multiple flow rates (i.e., different flow rates in cooling and heating mode). If an HVAC system operates at the same speed in either cooling or heating mode, these curves are not required. When these curves are not used, the associated ratio term in the equation above is assumed to be 1. The remaining calculations are identical to the simple single-speed fan model described above.
Variable Speed Fan Model
The model for the variable speed fan is similar to the simple single-speed fan model except for a part load factor that multiplies the fan power consumption.
The rest of the calculation is the same as for the simple fan.
Nomenclature for Simple Models[LINK]
Component Fan Model
The Fan:ComponentModel object is based upon combining: modified forms of fan, belt, motor, and variable-frequency-drive (VFD) element models (Stein and Hydeman 2004); a simplified fan pressure rise model with distribution system leakage, duct static pressure, and conditioned space pressure control effects included (Sherman and Wray 2010); and a diagnostic-based simplified duct static-pressure reset (SPR) scheme for air-handling systems (Federspiel 2004, 2005).
Fan electric power depends on fan air power (product of the airflow through and pressure rise across the fan), mechanical efficiencies (fan and belt), and electrical efficiencies (motor and drive). For systems with variable flows, none of these parameters is constant and all are interrelated. For example, Figure 189 shows that fan efficiency strongly depends on fan flow as well as pressure rise, although this is not obvious from the manufacturer’s power and speed performance map (top left). Fan efficiency maps can be derived from the manufacturer’s performance map using a commercially-available software-based data extraction tool such as DigitizeIt and by applying the following equation to the extracted data:
where ΔPfan is the fan pressure rise (Pa); Qfan is the fan flow at standard conditions (m3/s); and Hfan is the fan shaft power (W). Fan speed values also can be derived from the manufacturer’s performance map using a similar software-based data extraction tool.
Fan pressure rise must be sufficient to overcome the air-handling system pressure drop, which depends on duct static pressure, on duct and equipment leakage, and on pressure drops across duct and duct-like elements (e.g., dampers, fittings), coils, and filters that are connected to the fan. Duct and duct-like pressure drops increase approximately as the square of the flow through them. However, pressure drops across coils and filters behave differently: they are proportional to the flow raised to a power n, which can approach one for high-efficiency filters and wet coils (Liu et al. 2003, Trane 1999).
The relation between system pressure drop and flow defines what is commonly called a “system curve”. When system characteristics change, such as when the duct static pressure set point is varied, a family of system curves results. The intersections of these curves with fan curves (e.g., power as a function of pressure rise and flow) on a pressure versus flow plot define one or more loci of unique fan operating points. Each of these points has an associated fan efficiency, power, and speed.
Fan Pressure Rise Model: To calculate fan pressure rise based on flow through the fan, Sherman and Wray (2010) have developed a simple physics-based data-driven four parameter duct system model for the purpose of simulating its system curve. The embodiment of the model for a fixed outdoor air fraction that can be applied to constant- or variable-volume central air-handling systems is:
where ΔPfan,tot is the fan total pressure rise (Pa); Qfan is the fan flow at standard conditions (m3/s); Psm is the duct static pressure set point (Pa); Po is the static pressure of the spaces surrounding the ducts (Pa); and Afpr, Bfpr, Cfpr, and Dfpr are constant coefficients that represent different aspects of the fan pressure rise model as described below.
Fan static pressure rise is determined from the total pressure rise by subtracting the outlet velocity pressure:
where Afan,out is the fan outlet area (m2) and ρ is the air density at the fan inlet (kg/m3).
The first term in Equation looks like the common system curve in which the fan pressure rise is proportional to the square of the fan flow, but here it also depends implicitly on supply and return pressure losses, and in part on the fraction of the fan flow that is outdoor air (essentially “leaks” into and out of the return side of the system). Very often it is the only term considered, but that would only be correct with fixed-position dampers, no distribution system leakage, no linear resistance components, and no duct static pressure control.
The second term accounts for significant flow resistances in the system where the pressure difference is linearly proportional to the flow. Some filters and coils in the return may need this term to be adequately described. This term could be ignored if there are no linear components or if their pressure drops are very small compared to the other terms.
The third term, which depends on the fan flow and square root of the supply duct pressure Psm, accounts in part for air leakage from the supply system when damper positions are fixed or are changed independently of static pressure or fan flow. In this case, reducing or eliminating supply leakage results in a different system curve. This, however, might be only a minor “correction” to the simple system curves generally used. The third term is zero when VAV box dampers are modulated to control flow. Consequently, with variable-position supply dampers, reducing or eliminating supply leakage does not change the system curve.
The last term also accounts in part for leakage from the supply system when damper positions are fixed or are changed independently of static pressure or fan flow. This term indicates that the same fan pressure rise can be achieved by raising the duct pressure and closing dampers. The only change in the system in such a case is that the leakage flow may increase. The coefficient for this term is equal to one when the VAV box dampers are modulated to control flow. In both cases, this term may be the most important “correction” to the simple system curves generally used, especially at low flows.
In principle, especially for research applications of Energy Plus, the four individual fan pressure rise coefficients can be determined using duct design calculation tools for the entire system (e.g., Right-CommDuct, UNI-DUCT, Ductsize, Varitrane Duct Designer, T-Duct). In practice, however, especially for existing buildings, the necessary details may not be known sufficiently. In that case, one can make active measurements at different combinations of fan flows, outside air fractions, damper positions (if they are variable), and duct static pressures and then use non-linear system identification techniques to fit the data and determine the coefficients. If passive measurements can be made over a sufficiently long time so that a wide range of outside air settings, damper positions, and fan flows is obtained, one could instead regress the data to find all of the parameters in the equation. Unfortunately, there are no standardized test procedures available to draw upon, even though some standards appear to be related (e.g., ASHRAE 1999, 2008). Consequently, field test protocols need to be developed to determine the parameters for the new duct system model. These protocols then need to be integrated into standardized data collection and analysis tools such as Pacific Gas and Electric’s “Universal Translator” tool. The California Energy Commission is funding such a project; data, procedures, and tools from this project will support the EnergyPlus implementation of the fan and duct system models described here.
SPR Model: The model for duct-static-pressure reset (SPR) is based on a simple diagnostic procedure and a linear correlation between duct static pressure and supply fan airflow (Federspiel 2004, 2005). The diagnostic method involves measuring the static pressure at the duct static pressure sensor and the velocity pressure at the fan inlet (represents the fan flow) at multiple points over the fan’s operating range, while the VAV box dampers attempt to control flow in response to a constant thermostat setpoint. The goal of the test is to define the lowest duct static pressure where all VAV boxes are still in control (dampers modulating). In the model, the correlation between Psm and Qfan is as follows for Qfan,min ≤ Qfan ≤ Qfan,max:
Where
For Qfan < Qfan,min, Psm = Psm,min; for Qfan > Qfan,max, Psm = Psm,max
Fan Efficiency and Shaft Input Power Model: A dimensionless parameter in the form of an Euler number can be used to simplify the description of fan static efficiency variations:
where ΔPfan is the fan static pressure rise (Pa), Dfan is the fan wheel outer diameter (m), ρ is the air density at the fan inlet (kg/m3), and Qfan is the fan flow at standard conditions (m3/s). Eu is nominally the ratio of pressure forces across the fan to inertial forces at the fan wheel exit.
By plotting the normalized fan static efficiency (static efficiency / maximum static efficiency) versus the logarithm base 10 of the normalized Euler number (Eu / Eu at maximum static efficiency), the dimensionless performance of various fan sizes is very similar (as one might expect from the “fan laws”), but so also is the dimensionless performance of different types of fans (e.g., single-inlet plenum fans, double-inlet housed centrifugal fans, mixed flow fans, vane axial fans, fans with backward or forward curved blades). An example of this correlation for the “normal operation” (non-stall) and stall regions of eight fans is shown in Figure 190.
This model uses a continuous function to represent the normalized fan efficiency (ηfan) variation. The normalized exponential-conditioned skew-normal functional relationship is:
where
xfan = log10(Eu / Eumax)
Z1 = (xfan - afan) / bfan; Z2 = ((e(cfan*xfan)*dfan*xfan) - afan) / bfan; Z3 = -afan / bfan
For conceptual design when only rough estimates are needed, a generic curve (also shown in Figure 190) can be used and then one only needs to know the maximum efficiency (ηfan,max) and Eu at that maximum (Eumax) to entirely model the fan efficiency and hence fan power. The dimensionless coefficients for the generic normalized fan efficiency curve are as follows:
afan = -2.732094, bfan = 2.273014, cfan = 0.196344, dfan = 5.267518
In this case, the coefficient of determination R2 is 0.994. Also, the average and RMS differences between the efficiency values based on extracted data and the fitted generic curve are, respectively, about 0.5% and 1.4%; maximum differences are about ±9%.
If more accuracy is needed for a specific fan, a similarly shaped curve can be developed for that fan (using extracted data, Equation , and least-squares regression techniques), segmented into normal operation and stall regions with specific coefficients fitted for each region. Figure 191 shows an example, using the data from Figure 189.
For this specific fan, the coefficients are:
In this case, the average and RMS differences between the efficiency values based on extracted data and fitted specific curve (R2 is 0.999) are, respectively, about -0.1% and 0.3%; maximum differences are about ±0.7%. Field tests are especially needed to determine the coefficients for installed fans because fans are susceptible to “system effects” (e.g., inlet obstructions) that are not included in the manufacturer test data (AMCA 1990a).
To determine fan efficiency and fan shaft power at a particular time step, first calculate the fan pressure rise (ΔPfan) using the time step fan flow (Qfan) and Equation (and also using Equations and if there is SPR). Next, calculate Eu using Equation and then xfan (log10 normalized Eu), which is based on Eu and the specified Eumax (Eu at maximum efficiency) for the fan. The corresponding normalized efficiency (ηfan(xfan) / ηfan,max) is obtained using Equation . The fan efficiency (ηfan(xfan)) therefore is:
The fan shaft input power (mechanical, W) is:
Fan Shaft Speed and Torque Modeling: For rotating elements, power (H) is the product of torque (τ) and rotational speed (ω), or conversely, torque is power divided by rotational speed (τ = H / ω).
The Stein and Hydeman variable-frequency-drive (VFD) component model correlates VFD efficiency as a linear function of VFD fractional output power (i.e., motor input power). Available data for about 50 drives from Saftronics were apparently used to develop their model, but those data represent VFD efficiency as a function of motor fractional speed(ωmotor / ωmotor,max, or nominally, drive output frequency divided by maximum output frequency, if motor slip is ignored).
To make use of the available data, the Stein and Hydeman linear correlation must intrinsically make an assumption that motor speed and torque have some fixed relationship. Although not documented, their assumption might be the common belief that fractional torque (τ / τmax) for a motor is simply the square of its fractional speed. For fans serving duct systems with components such as filters and coils, with relatively low pressure drops elsewhere in the system, and for systems that have a non-zero controlled duct static pressure, this assumption may be inappropriate. Consequently, to make use of the available data and to avoid such assumptions, one needs to know the fraction of full speed at which fan components operate.
For the fan, dimensionless flow (φ) can be defined as (ASHRAE 1993):
where ωfan is the fan speed (rad/s). This parameter can be calculated for each operating point on the fan manufacturer’s performance map that represents fan speed as a function of flow and fan pressure rise. To simplify the data representation to a single curve (as we have done for fan efficiency), one can plot normalized dimensionless flow (dimensionless flow divided by maximum dimensionless flow, (φ(xfan) / φmax) as a function of the log base 10 of the normalized Euler (Eu) parameter (xfan). Figure 192 shows an example plot derived from the manufacturer’s data in Figure 189.
Equation describes the sigmoidal functional form for normalized φ:
where Aspd, Bspd, Cspd, Dspd, and Espd are coefficients for the fan. Separate sets of coefficients for the normal operation and stall regions can be specified. For the curve shown in Figure 192, these coefficients are:
For a generic centrifugal fan with backward-curved blades, the coefficients are:
For any operating point of flow (Qfan) and fan pressure rise (ΔPfan), one can calculate the corresponding Euler number (Eu) for the given fan, and then determine the corresponding normalized dimensionless flow (φ(xfan) / φmax) from the sigmoidal dimensionless flow function (Equation ). With φ(xfan) / φmax determined and knowing φmax for the fan, the dimensionless flow is:
With φ(xfan) determined, the fan rotational speed (rad/s) is:
Fan shaft torque (N∙m), which the belt drive must supply to the fan shaft, is then:
The fraction of full-load driven torque for the belt (τfan / τbelt,max), which is typically called “belt load”, is thus τfan divided by the belt torque capacity (τbelt,max). For a particular belt type and cross-section, belt torque capacity can be determined from manufacturer’s information such as a shaft speed versus power chart.
Ignoring belt slip, motor shaft speed (ωmotor, rad/s) can then be determined using the fan speed (ωfan) and the motor/fan pulley diameter ratio (Dpulley,motor / Dpulley,fan), which is typically called the “drive” ratio:
Belt, Motor, and Variable-Frequency-Drive Efficiency and Input Power Models – Overview: The models for belt drives, motors, and VFDs that Stein and Hydeman included in their air-handling system model represent maximum efficiency as a function of power input to the adjacent downstream component (e.g., the power input to a fan shaft by a belt drive), but they do not include part-load models. The part-load models are needed, because part-load efficiency for these components can fall off rapidly at low load (e.g., to zero at zero load) and many systems operate occasionally (and some much of the time) at low loads, in part because of current practices that result in substantial oversizing of components.
Belt Efficiency and Input Power Model: Figure 193 shows three maximum efficiency (ηbelt,max) curves for belts (low, medium, and high) as a function of maximum fan shaft torque. This set of efficiency curves is based on belt drive loss data from AMCA Publication 203 (1990b), which reportedly is an aggregation of data from over 400 tests.
To determine ηbelt,max if data for a specific belt are not available, first use the maximum fan shaft input power (Hfan,max) for the load spectrum to calculate the natural logarithm of belt power capacity:
xbelt,max = ln(Hfan,max) with Hfan,max expressed in terms of hp()
Then, use Equations and , along with a choice of low, medium, or high efficiency coefficients from Table 60, to calculate ηbelt,max.
The quartic polynomial curves in Figure 193 and their coefficients are as follows:
The belt maximum efficiency is therefore:
The normalized part-load belt efficiency model is provided to modify the maximum efficiency of the belt. This model is based on part-load data for belts in ACEEE’s handbook on motor systems (Nadel et al. 2002). To determine the normalized belt efficiency at part-load (ηbelt(xbelt) **/ ηbelt,max), use the fan shaft (belt output) fractional torque (xbelt = τbelt / τbelt,max;τbelt = τfan) as the belt fractional load in Equation or (select the equation for the region that contains xbelt) and use coefficients from Table 61 that correspond to that region and the belt type: V-Belt or synchronous (toothed). Figure 194 shows a graphical representation of the curves defined by these equations and coefficients.
The belt normalized (part-load) efficiency curves in Figure 194 for Regions 1 and 3 (single rectangular hyperbola type 2) and Region 2 (exponential decay), respectively, and their coefficients are as follows:
Region 1 (0 <= xbelt < xbelt,trans) and Region 3 (xbelt > 1):
Region 2 (xbelt,trans <= xbelt <= 1):
where xbelt = belt /
  belt,max
Belt efficiency therefore is:
Belt input power (mechanical, W) at the motor shaft is:
Belt Normalized Efficiency Curve Coefficients
Belt Type
xbelt,trans
Region
abelt
bbelt
cbelt
V-Belt
0.167
1
0.920797
0.026269
0.151594
2
1.011965
-0.339038
-3.436260
3
1.037778
0.010307
-0.026815
Synchronous
0.137
1
0.982167
0.049135
0.158164
2
1.002134
-0.531885
-5.295707
3
1
0
0
Motor Efficiency and Input Power Model: Figure 195 shows three maximum efficiency (ηmotor,max) curves for motors (low, medium, and high) as a function of rated motor output power (belt input power). This set of efficiency curves is based on maximum efficiency data in DOE’s MotorMaster+ database (2003) from about 800 tests. It is provided for use in the absence of manufacturer’s data.
To determine ηmotor,max if data for a specific motor are not available (e.g., as listed in Table 63), first use the maximum belt input power (Hbelt,max) for the load spectrum (multiplied by whatever oversizing factor may be desired) to calculate the natural logarithm of belt power capacity:
xmotor,max = ln(Hbelt,max) with Hbelt,max expressed in terms of hp()
Then, use Equation , along with a choice of low, medium, or high efficiency coefficients from Table 62, to calculate ηmotor,max.
The maximum motor efficiency curves in Figure 195 (single rectangular hyperbola type 1) and their coefficients are as follows:
The normalized part-load motor efficiency model is provided to modify the maximum efficiency of the motor. This model is based on part-load data for motors from DOE’s MotorMaster+ database (2003). To determine the normalized motor efficiency at part-load (ηmotor(xmotor) **/ ηmotor,max), use the motor fractional power output (xmotor = Hbelt / Hbelt,max) as the fraction of motor output power in Equation and use coefficients from Table 63, or for a specific motor, determined from DOE MotorMaster+ data or from manufacturer’s data. Figure 196 shows a graphical representation of eight example curves defined by these equations and coefficients.
The example motor normalized efficiency curves (single rectangular hyperbola type 2) and their coefficients as a function of motor load fraction in Figure 196 are determined from DOE MotorMaster+ data and are as follows:
Example Motor Normalized Efficiency Curve Coefficients
Poles
Motor RatedOutput (hp)
MaximumEfficiency
aPLmotor
bPLmotor
cPLmotor
8
1
0.6675
1.096694
0.097126
0.002011
4
1
0.7787
1.092165
0.082060
-0.007200
5
0.8400
1.223684
0.084670
-0.135186
10
0.8745
1.146258
0.045766
-0.110367
25
0.8991
1.137209
0.050236
-0.089150
50
0.9129
1.088803
0.029753
-0.064058
75
0.9259
1.077140
0.029005
-0.049350
100
0.9499
1.035294
0.012948
-0.024708
125
0.9527
1.030968
0.010696
-0.023514
Motor efficiency therefore is:
Motor input power (electrical, W) is:
VFD Efficiency and Input Power Model: For VFDs, published performance data are limited. Data from DOE (2008) suggest using a functional relation similar to that used for motors to represent VFD efficiency (ηVFD) as a function of the fraction of full-load motor input power (xVFD = Hmotor / Hmotor,max), as shown in Figure 197, or as a function of the fraction of full-load speed (xVFD = ωmotor / ωmotor,max), as shown in Figure 198.
The performance curve (single rectangular hyperbola type 2) used here for VFD efficiency is:
Example coefficients derived from the DOE data as a function of the fraction of full-load motor input power are listed in Table 64.
VFD input power (electrical, W) is:
System Total Efficiency: The combined efficiency of the fan system components (i.e., fan, belt, motor, and VFD) is:
Heat Loss to Air: To calculate the temperature rise from waste heat entering the air stream from the fan, belt, and motor, it is assumed that the user-specified “motor in air fraction” applies to the belt and motor but not to the VFD. The power “lost” to the air (W) is:
References[LINK]
AMCA. 1990a. “Fans and Systems”. Publication 201-90. Arlington Heights, IL: Air Movement and Control Association International.
AMCA. 1990b. “Field Performance Measurement of Fan Systems”. Publication 203-90. Arlington Heights, IL: Air Movement and Control Association International.
ASHRAE. 1993. HVAC 2 Toolkit: Algorithms and Subroutines for Secondary HVAC System Energy Calculations. Atlanta: American Society of Heating, Refrigerating and Air-Conditioning Engineers, Inc.
ASHRAE. 1999. “ANSI/ASHRAE Standard 120 Method of Testing to Determine Flow Resistance of HVAC Ducts and Fittings”. Atlanta: American Society of Heating, Refrigerating and Air-Conditioning Engineers, Inc.
ASHRAE. 2008. “ANSI/ASHRAE Standard 126 Method of Testing HVAC Air Ducts and Fittings”. Atlanta: American Society of Heating, Refrigerating and Air-Conditioning Engineers, Inc.
DOE. 2003. “MotorMaster 4.0 User Guide”. U.S. Department of Energy, Industrial Technologies Program.
http://www1.eere.energy.gov/industry/bestpractices/software_motormaster.html
DOE. 2008. “Energy Tips – Motor: Motor Tip Sheet #11”. U.S. Department of Energy, Industrial Technologies Program. June.
http://www1.eere.energy.gov/industry/bestpractices/pdfs/motor_tip_sheet11.pdf
Federspiel, C. 2004. “Detecting Optimal Fan Pressure”. Final Report of Federspiel Controls to the CEC Energy Innovations Small Grant Program. Grant #: 02-03.
Federspiel, C. 2005. “Detecting Critical Supply Duct Pressure”. ASHRAE Transactions, Vol. 111, Part 1. Atlanta: American Society of Heating, Refrigerating and Air-Conditioning Engineers, Inc.
Heredos, Francis P. 1987. Selection and Application of Multispeed Motors, IEEE Transactions on Industry Applications, Vol. 1A-23, No. 2, March/April.
Liu, M., D.E. Claridge, and S. Deng. 2003. “An Air Filter Pressure Loss Model for Fan Energy Calculation in Air-Handling Units”. International Journal of Energy Research. Vol. 27, pp. 589-600.
Nadel, S., R.N. Elliot, M. Shepard, S. Greenberg, G. Katz, and A.T. de Almeida. 2002. “Energy-Efficient Motor Systems: A Handbook on Technology, Program, and Policy Opportunities” 2nd Edition. Washington, DC: American Council for an Energy Efficient Economy. p.188.
Sherman, M.H. and C.P. Wray. 2010. “Parametric System Curves: Correlations Between Fan Pressure Rise and Flow for Large Commercial Buildings”. Lawrence Berkeley National Laboratory Report, LBNL-3542E.
Stein, J. and M.M. Hydeman. 2004. “Development and Testing of the Characteristic Curve Fan Model”. ASHRAE Transactions, Vol. 110, Part 1. Atlanta: American Society of Heating, Refrigerating and Air-Conditioning Engineers, Inc.
Trane. 1999. “Delta-Flo Coils: Data Catalog PL-AH-COIL-000-D-2-799”. LaCrosse, WI: The Trane Company. July.
Documentation content copyright © 1996-2026 The Board of Trustees of the University of Illinois and the Regents of the University of California through the Ernest Orlando Lawrence Berkeley National Laboratory. All rights reserved. EnergyPlus is a trademark of the US Department of Energy.
This documentation is made available under the EnergyPlus Open Source License v1.0.